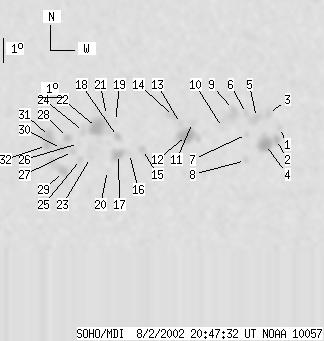
SOHO MDI 2002-08-02 20:47:32 UT
| group | Proj. U | Proj. WS | Corr. U | Corr. WS | B | L | LCM | Pos. angle | r | MU | MP |
| 98 | 427 | 50 | 223 | -8.01 | 145.60 | 9.67 | 213.96 | 0.2964 | 19.7 | 106.8 | |
|
previous
or next observation for the same group /
back to the solar disc SOHO MDI 2002-08-02 20:47:32 UT |
| spot | Proj. U | Proj. WS | Corr. U | Corr. WS | B | L | LCM | Pos. angle | r | MU | MP |
| 0 | 10 | 0 | 5 | -7.69 | 150.64 | 14.71 | 227.32 | 0.3438 | 557.0 | 337.2 | |
| 5 | 52 | 3 | 27 | -8.18 | 150.53 | 14.60 | 226.08 | 0.3480 | -948.9 | -744.7 | |
| 0 | 9 | 0 | 5 | -7.11 | 150.17 | 14.24 | 227.66 | 0.3316 | 1129.0 | 892.2 | |
| 16 | -2 | 8 | -2 | -8.37 | 150.09 | 14.16 | 224.79 | 0.3450 | -1465.5 | 999999 | |
| 0 | 15 | 0 | 8 | -7.26 | 149.68 | 13.75 | 226.32 | 0.3274 | 911.0 | 229.1 | |
| 0 | 5 | 0 | 3 | -7.09 | 149.26 | 13.33 | 225.82 | 0.3205 | 883.0 | 541.1 | |
| 0 | 4 | 0 | 2 | -7.94 | 149.29 | 13.36 | 224.01 | 0.3308 | -729.0 | -460.7 | |
| 0 | 5 | 0 | 3 | -9.00 | 149.29 | 13.36 | 221.84 | 0.3435 | 511.0 | 223.2 | |
| 0 | 24 | 0 | 13 | -6.91 | 148.73 | 12.80 | 225.03 | 0.3121 | 460.0 | -467.2 | |
| 0 | 8 | 0 | 4 | -7.63 | 148.30 | 12.37 | 222.45 | 0.3159 | -785.0 | -560.4 | |
| 0 | 6 | 0 | 3 | -7.40 | 147.07 | 11.14 | 219.97 | 0.2996 | -929.0 | -649.8 | |
| 20 | 48 | 10 | 25 | -7.93 | 146.84 | 10.91 | 218.28 | 0.3039 | -1492.6 | -615.3 | |
| 0 | 5 | 0 | 3 | -7.43 | 146.58 | 10.65 | 218.64 | 0.2948 | -962.0 | -731.2 | |
| 0 | 11 | 0 | 5 | -7.14 | 146.29 | 10.36 | 218.49 | 0.2880 | -962.0 | -848.8 | |
| 0 | 12 | 0 | 6 | -8.46 | 145.07 | 9.14 | 212.43 | 0.2942 | 419.0 | 346.5 | |
| 0 | 3 | 0 | 2 | -8.62 | 144.54 | 8.62 | 210.65 | 0.2918 | -534.0 | -507.4 | |
| 7 | 24 | 4 | 12 | -8.65 | 144.10 | 8.17 | 209.27 | 0.2886 | -1056.1 | -601.3 | |
| 4 | 9 | 2 | 5 | -7.92 | 144.04 | 8.12 | 210.41 | 0.2775 | 602.1 | 371.9 | |
| 0 | 3 | 0 | 2 | -7.31 | 143.95 | 8.02 | 211.28 | 0.2678 | 470.0 | 356.3 | |
| 0 | 3 | 0 | 2 | -9.30 | 143.67 | 7.74 | 206.93 | 0.2948 | 493.0 | 318.1 | |
| 0 | 4 | 0 | 2 | -7.06 | 143.59 | 7.66 | 210.58 | 0.2611 | 829.0 | 671.6 | |
| 23 | 47 | 12 | 24 | -7.54 | 143.19 | 7.26 | 208.38 | 0.2649 | 1546.1 | 902.0 | |
| 0 | 16 | 0 | 8 | -8.76 | 142.97 | 7.04 | 205.62 | 0.2815 | -534.0 | -63.3 | |
| 0 | 4 | 0 | 2 | -7.70 | 142.67 | 6.74 | 206.36 | 0.2632 | 963.0 | 757.4 | |
| 0 | 6 | 0 | 3 | -8.84 | 142.57 | 6.64 | 204.22 | 0.2799 | 423.0 | 474.3 | |
| 0 | 2 | 0 | 1 | -8.18 | 142.48 | 6.55 | 204.92 | 0.2692 | 577.0 | 453.8 | |
| 0 | 6 | 0 | 3 | -8.51 | 142.24 | 6.31 | 203.63 | 0.2726 | 670.0 | 574.1 | |
| 4 | 11 | 2 | 6 | -7.93 | 142.03 | 6.10 | 203.79 | 0.2623 | 1049.3 | 713.7 | |
| 7 | 29 | 3 | 15 | -9.32 | 141.89 | 5.97 | 201.35 | 0.2830 | 1242.4 | 930.3 | |
| 0 | 9 | 0 | 5 | -8.38 | 141.80 | 5.87 | 202.31 | 0.2677 | 1284.0 | 1016.7 | |
| 8 | 37 | 4 | 19 | -7.88 | 141.31 | 5.38 | 201.30 | 0.2568 | 1444.1 | 983.4 | |
| 4 | -31 | 2 | -31 | -8.25 | 141.19 | 5.27 | 200.38 | 0.2619 | 1203.5 | 999999 | |
| Proj. U | - Projected umbra area in millionths of solar disc, negative values indicate | |
|
that the umbra consists of fragmented regions which cannot be separated without losing umbral area. In this way several spots (intensity minima in the umbra) have a common umbra, e.g. -2 means that the given spot shares an umbra with spot No.2, and the common U value is indicated at spot No.2. |
||
| Proj. WS | - Projected whole spot area in millionths of solar disc, negative values indicate | |
|
that several umbras have a common penumbra, e.g. -7 means that the given umbra shares a penumbra with umbra No.7, and the WS value is indicated at No.7. |
||
| Corr. U | - Corrected umbra area in millionths of solar hemisphere, for negative values see above | |
| Corr. WS | - Corrected whole spot area in millionths of solar hemisphere, for negative values see above | |
| B | - Heliographic latitude B; positive: North, negative: South | |
| L | - Heliographic longitude L | |
| LCM | - Longitudinal distance from the Sun's central meridian | |
| Pos. angle | - Position angle | |
| r | - Distance from the centre of Sun's disc in terms of Sun's radius | |
| MU | - Mean magnetic field within the umbra contour averaged the pixel values with sign. | |
| MP | - Mean magnetic field within the penumbra contour averaged the pixel values with sign. | |