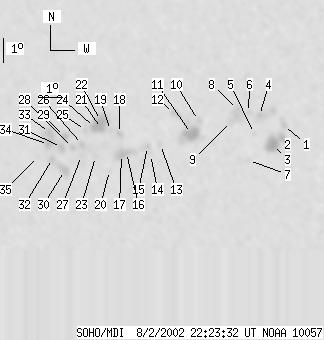
SOHO MDI 2002-08-02 22:23:32 UT
| group | Proj. U | Proj. WS | Corr. U | Corr. WS | B | L | LCM | Pos. angle | r | MU | MP |
| 99 | 470 | 50 | 245 | -8.01 | 145.35 | 10.30 | 215.58 | 0.3026 | -61.8 | 136.4 | |
|
previous
or next observation for the same group /
back to the solar disc SOHO MDI 2002-08-02 22:23:32 UT |
| spot | Proj. U | Proj. WS | Corr. U | Corr. WS | B | L | LCM | Pos. angle | r | MU | MP |
| 0 | 10 | 0 | 5 | -7.67 | 150.75 | 15.70 | 229.23 | 0.3557 | 358.0 | 270.3 | |
| 5 | 49 | 2 | 26 | -8.16 | 150.73 | 15.68 | 228.16 | 0.3607 | -1069.1 | -757.3 | |
| 19 | -2 | 10 | -2 | -8.43 | 150.32 | 15.28 | 226.84 | 0.3588 | -1395.9 | 999999 | |
| 2 | 41 | 1 | 21 | -7.23 | 149.74 | 14.69 | 228.28 | 0.3386 | 848.3 | 477.7 | |
| 0 | 4 | 0 | 2 | -7.96 | 149.56 | 14.51 | 226.35 | 0.3445 | -663.0 | -533.9 | |
| 0 | 5 | 0 | 3 | -7.10 | 149.28 | 14.24 | 227.67 | 0.3315 | 159.0 | 401.8 | |
| 0 | 5 | 0 | 2 | -9.06 | 149.35 | 14.31 | 223.70 | 0.3548 | 520.0 | 368.3 | |
| 0 | 19 | 0 | 10 | -6.97 | 148.83 | 13.78 | 227.04 | 0.3245 | 349.0 | -489.0 | |
| 0 | 6 | 0 | 3 | -7.45 | 148.60 | 13.55 | 225.47 | 0.3273 | -701.0 | -666.6 | |
| 0 | 4 | 0 | 2 | -7.37 | 147.24 | 12.20 | 222.61 | 0.3109 | -975.0 | -773.7 | |
| 19 | 48 | 10 | 25 | -7.90 | 146.97 | 11.93 | 220.84 | 0.3144 | -1520.1 | -846.8 | |
| 0 | 11 | 0 | 6 | -7.03 | 146.22 | 11.17 | 220.86 | 0.2952 | -1115.0 | -813.1 | |
| 0 | 5 | 0 | 2 | -8.32 | 145.72 | 10.68 | 216.87 | 0.3068 | -659.0 | -581.8 | |
| 0 | 4 | 0 | 2 | -8.72 | 145.33 | 10.28 | 215.07 | 0.3084 | 623.0 | 433.4 | |
| 0 | 9 | 0 | 5 | -8.39 | 145.20 | 10.15 | 215.35 | 0.3026 | 396.0 | -70.8 | |
| 2 | 30 | 1 | 16 | -8.62 | 144.35 | 9.30 | 212.61 | 0.2979 | -1010.8 | -717.9 | |
| 5 | -16 | 3 | -16 | -8.70 | 144.15 | 9.10 | 211.90 | 0.2973 | -1093.5 | 999999 | |
| 2 | 7 | 1 | 4 | -7.84 | 144.05 | 9.00 | 213.21 | 0.2842 | 703.8 | 459.3 | |
| 0 | 4 | 0 | 2 | -7.71 | 143.68 | 8.64 | 212.37 | 0.2791 | 512.0 | 511.9 | |
| 0 | 3 | 0 | 2 | -9.35 | 143.68 | 8.63 | 209.45 | 0.3026 | 349.0 | 350.5 | |
| 4 | 49 | 2 | 25 | -7.63 | 143.32 | 8.27 | 211.43 | 0.2746 | 1312.7 | 1004.3 | |
| 11 | -21 | 5 | -21 | -7.30 | 143.27 | 8.22 | 211.92 | 0.2696 | 1637.1 | 999999 | |
| 0 | 4 | 0 | 2 | -8.76 | 143.10 | 8.05 | 208.72 | 0.2894 | -525.0 | -284.7 | |
| 6 | -21 | 3 | -21 | -7.58 | 143.03 | 7.99 | 210.63 | 0.2716 | 1530.6 | 999999 | |
| 0 | 9 | 0 | 5 | -7.70 | 142.67 | 7.63 | 209.27 | 0.2702 | 1071.0 | 704.6 | |
| 0 | 16 | 0 | 8 | -8.27 | 142.56 | 7.52 | 207.92 | 0.2778 | 1145.0 | 543.7 | |
| 0 | 15 | 0 | 8 | -8.72 | 142.53 | 7.49 | 207.07 | 0.2842 | 233.0 | 401.6 | |
| 0 | 7 | 0 | 4 | -8.38 | 142.16 | 7.12 | 206.45 | 0.2764 | 963.0 | 671.5 | |
| 4 | 11 | 2 | 5 | -7.93 | 141.83 | 6.79 | 206.11 | 0.2672 | 1059.3 | 766.8 | |
| 6 | 17 | 3 | 9 | -9.32 | 141.86 | 6.81 | 204.05 | 0.2885 | 1218.6 | 951.9 | |
| 4 | 68 | 2 | 35 | -8.38 | 141.72 | 6.67 | 205.01 | 0.2731 | 1216.4 | 854.6 | |
| 0 | 7 | 0 | 4 | -8.82 | 141.37 | 6.32 | 203.18 | 0.2776 | 1126.0 | 903.6 | |
| 4 | -31 | 2 | -31 | -7.76 | 141.23 | 6.18 | 204.32 | 0.2602 | 1426.3 | 999999 | |
| 6 | -31 | 3 | -31 | -8.25 | 141.20 | 6.15 | 203.45 | 0.2675 | 1220.3 | 999999 | |
| 0 | 3 | 0 | 2 | -8.73 | 140.76 | 5.71 | 201.28 | 0.2723 | -283.0 | -167.0 | |
| Proj. U | - Projected umbra area in millionths of solar disc, negative values indicate | |
|
that the umbra consists of fragmented regions which cannot be separated without losing umbral area. In this way several spots (intensity minima in the umbra) have a common umbra, e.g. -2 means that the given spot shares an umbra with spot No.2, and the common U value is indicated at spot No.2. |
||
| Proj. WS | - Projected whole spot area in millionths of solar disc, negative values indicate | |
|
that several umbras have a common penumbra, e.g. -7 means that the given umbra shares a penumbra with umbra No.7, and the WS value is indicated at No.7. |
||
| Corr. U | - Corrected umbra area in millionths of solar hemisphere, for negative values see above | |
| Corr. WS | - Corrected whole spot area in millionths of solar hemisphere, for negative values see above | |
| B | - Heliographic latitude B; positive: North, negative: South | |
| L | - Heliographic longitude L | |
| LCM | - Longitudinal distance from the Sun's central meridian | |
| Pos. angle | - Position angle | |
| r | - Distance from the centre of Sun's disc in terms of Sun's radius | |
| MU | - Mean magnetic field within the umbra contour averaged the pixel values with sign. | |
| MP | - Mean magnetic field within the penumbra contour averaged the pixel values with sign. | |