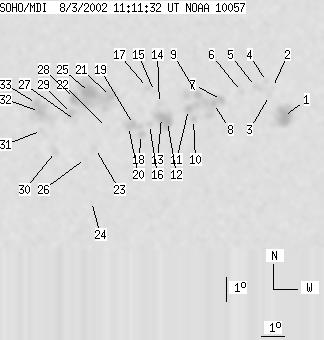
SOHO MDI 2002-08-03 11:11:32 UT
| group | Proj. U | Proj. WS | Corr. U | Corr. WS | B | L | LCM | Pos. angle | r | MU | MP |
| 115 | 562 | 64 | 302 | -7.84 | 145.39 | 17.40 | 231.15 | 0.3801 | -98.8 | 7.4 | |
|
previous
or next observation for the same group /
back to the solar disc SOHO MDI 2002-08-03 11:11:32 UT |
| spot | Proj. U | Proj. WS | Corr. U | Corr. WS | B | L | LCM | Pos. angle | r | MU | MP |
| 21 | 57 | 12 | 32 | -8.40 | 151.44 | 23.45 | 238.67 | 0.4628 | -1448.2 | -897.8 | |
| 0 | 3 | 0 | 2 | -7.20 | 150.89 | 22.90 | 240.37 | 0.4460 | 652.0 | 527.0 | |
| 0 | 4 | 0 | 2 | -7.52 | 150.78 | 22.79 | 239.62 | 0.4470 | -447.0 | -298.5 | |
| 0 | 5 | 0 | 3 | -6.94 | 150.62 | 22.63 | 240.57 | 0.4403 | 944.0 | 679.7 | |
| 0 | 9 | 0 | 5 | -7.13 | 150.15 | 22.16 | 239.68 | 0.4354 | 778.0 | 568.7 | |
| 0 | 4 | 0 | 2 | -7.31 | 149.56 | 21.57 | 238.63 | 0.4289 | -892.0 | -562.3 | |
| 4 | 94 | 2 | 51 | -7.60 | 148.72 | 20.73 | 237.00 | 0.4201 | -1005.8 | -831.3 | |
| 3 | -7 | 2 | -7 | -7.75 | 148.39 | 20.40 | 236.26 | 0.4170 | -1098.2 | 999999 | |
| 5 | -7 | 3 | -7 | -7.36 | 147.69 | 19.70 | 236.13 | 0.4043 | -1267.1 | 999999 | |
| 3 | 6 | 1 | 3 | -8.37 | 147.57 | 19.58 | 233.91 | 0.4120 | 297.2 | 142.8 | |
| 6 | -7 | 3 | -7 | -7.95 | 147.33 | 19.34 | 234.41 | 0.4051 | -1119.3 | 999999 | |
| 9 | 47 | 5 | 25 | -8.41 | 146.47 | 18.48 | 232.22 | 0.3984 | -1185.0 | -778.9 | |
| 7 | -12 | 4 | -12 | -8.24 | 146.21 | 18.22 | 232.17 | 0.3934 | -1562.6 | 999999 | |
| 0 | 9 | 0 | 5 | -7.67 | 146.10 | 18.11 | 233.18 | 0.3864 | 641.0 | 165.6 | |
| 0 | 5 | 0 | 3 | -7.17 | 145.87 | 17.88 | 233.87 | 0.3787 | 604.0 | 438.2 | |
| 0 | 4 | 0 | 2 | -8.51 | 145.72 | 17.73 | 230.86 | 0.3899 | -889.0 | -649.9 | |
| 0 | 5 | 0 | 3 | -7.00 | 145.57 | 17.58 | 233.78 | 0.3732 | 817.0 | 577.2 | |
| 3 | 34 | 2 | 18 | -8.91 | 145.40 | 17.41 | 229.55 | 0.3901 | -640.5 | -684.4 | |
| 4 | -18 | 2 | -18 | -8.49 | 145.05 | 17.06 | 229.81 | 0.3814 | -1283.7 | 999999 | |
| 2 | -18 | 1 | -18 | -8.56 | 144.84 | 16.85 | 229.31 | 0.3797 | -1101.1 | 999999 | |
| 4 | 154 | 2 | 81 | -7.32 | 144.04 | 16.05 | 230.53 | 0.3567 | 725.1 | 580.3 | |
| 0 | 2 | 0 | 1 | -8.58 | 143.92 | 15.93 | 227.68 | 0.3687 | -783.0 | -609.3 | |
| 0 | 6 | 0 | 3 | -9.42 | 143.50 | 15.51 | 225.24 | 0.3732 | 808.0 | 602.9 | |
| 0 | 3 | 0 | 2 | -11.61 | 143.45 | 15.46 | 221.20 | 0.3981 | 594.0 | 497.5 | |
| 20 | -21 | 11 | -21 | -7.13 | 143.16 | 15.17 | 229.35 | 0.3438 | 1536.5 | 999999 | |
| 0 | 4 | 0 | 2 | -9.82 | 143.11 | 15.12 | 223.74 | 0.3733 | 558.0 | 466.2 | |
| 0 | 6 | 0 | 3 | -8.25 | 142.63 | 14.64 | 225.90 | 0.3497 | 516.0 | 390.4 | |
| 9 | -21 | 5 | -21 | -7.36 | 142.55 | 14.56 | 227.67 | 0.3388 | 1387.7 | 999999 | |
| 5 | 19 | 3 | 10 | -7.96 | 142.45 | 14.46 | 226.16 | 0.3444 | 1138.4 | 806.6 | |
| 0 | 7 | 0 | 4 | -9.50 | 141.85 | 13.86 | 221.86 | 0.3556 | 1124.0 | 902.0 | |
| 0 | 11 | 0 | 6 | -8.63 | 141.24 | 13.25 | 222.28 | 0.3383 | 934.0 | 507.8 | |
| 5 | 64 | 3 | 34 | -7.85 | 141.13 | 13.14 | 223.65 | 0.3277 | 1586.8 | 938.7 | |
| 5 | -32 | 3 | -32 | -7.52 | 141.00 | 13.01 | 224.06 | 0.3223 | 1424.8 | 999999 | |
| Proj. U | - Projected umbra area in millionths of solar disc, negative values indicate | |
|
that the umbra consists of fragmented regions which cannot be separated without losing umbral area. In this way several spots (intensity minima in the umbra) have a common umbra, e.g. -2 means that the given spot shares an umbra with spot No.2, and the common U value is indicated at spot No.2. |
||
| Proj. WS | - Projected whole spot area in millionths of solar disc, negative values indicate | |
|
that several umbras have a common penumbra, e.g. -7 means that the given umbra shares a penumbra with umbra No.7, and the WS value is indicated at No.7. |
||
| Corr. U | - Corrected umbra area in millionths of solar hemisphere, for negative values see above | |
| Corr. WS | - Corrected whole spot area in millionths of solar hemisphere, for negative values see above | |
| B | - Heliographic latitude B; positive: North, negative: South | |
| L | - Heliographic longitude L | |
| LCM | - Longitudinal distance from the Sun's central meridian | |
| Pos. angle | - Position angle | |
| r | - Distance from the centre of Sun's disc in terms of Sun's radius | |
| MU | - Mean magnetic field within the umbra contour averaged the pixel values with sign. | |
| MP | - Mean magnetic field within the penumbra contour averaged the pixel values with sign. | |