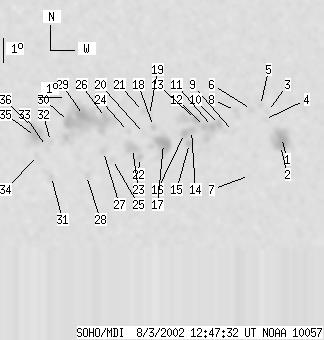
SOHO MDI 2002-08-03 12:47:32 UT
| group | Proj. U | Proj. WS | Corr. U | Corr. WS | B | L | LCM | Pos. angle | r | MU | MP |
| 114 | 557 | 60 | 299 | -7.79 | 145.73 | 18.63 | 233.19 | 0.3950 | -198.7 | -23.8 | |
|
previous
or next observation for the same group /
back to the solar disc SOHO MDI 2002-08-03 12:47:32 UT |
| spot | Proj. U | Proj. WS | Corr. U | Corr. WS | B | L | LCM | Pos. angle | r | MU | MP |
| 10 | 64 | 6 | 36 | -8.28 | 151.60 | 24.49 | 240.00 | 0.4757 | -1527.7 | -788.7 | |
| 9 | -1 | 5 | -1 | -8.60 | 151.58 | 24.47 | 239.38 | 0.4779 | -1204.4 | 999999 | |
| 0 | 4 | 0 | 2 | -7.19 | 150.92 | 23.81 | 241.34 | 0.4584 | 626.0 | 555.2 | |
| 0 | 3 | 0 | 2 | -7.51 | 150.81 | 23.70 | 240.61 | 0.4593 | -361.0 | -284.5 | |
| 0 | 4 | 0 | 2 | -6.94 | 150.60 | 23.50 | 241.51 | 0.4521 | 765.0 | 582.4 | |
| 0 | 4 | 0 | 2 | -7.08 | 150.22 | 23.11 | 240.82 | 0.4480 | 871.0 | 697.3 | |
| 0 | 3 | 0 | 2 | -9.78 | 150.31 | 23.20 | 235.87 | 0.4709 | -733.0 | -554.0 | |
| 0 | 12 | 0 | 6 | -7.09 | 149.53 | 22.42 | 240.03 | 0.4387 | 258.0 | -203.9 | |
| 0 | 4 | 0 | 2 | -7.94 | 149.49 | 22.38 | 238.32 | 0.4450 | -537.0 | -524.4 | |
| 4 | 61 | 2 | 33 | -7.64 | 148.87 | 21.76 | 238.19 | 0.4342 | -922.5 | -825.4 | |
| 4 | -10 | 2 | -10 | -7.70 | 148.57 | 21.46 | 237.70 | 0.4308 | -1107.7 | 999999 | |
| 3 | -10 | 1 | -10 | -7.69 | 148.23 | 21.12 | 237.30 | 0.4261 | -1271.9 | 999999 | |
| 4 | -10 | 2 | -10 | -7.39 | 147.83 | 20.72 | 237.40 | 0.4183 | -1271.9 | 999999 | |
| 3 | 18 | 2 | 10 | -7.83 | 147.68 | 20.57 | 236.32 | 0.4201 | -1221.8 | -827.7 | |
| 4 | 7 | 2 | 4 | -8.36 | 147.62 | 20.51 | 235.20 | 0.4240 | 178.6 | 5.2 | |
| 5 | -14 | 3 | -14 | -7.94 | 147.39 | 20.28 | 235.71 | 0.4172 | -1193.0 | 999999 | |
| 17 | 61 | 9 | 33 | -8.32 | 146.51 | 19.41 | 233.76 | 0.4094 | -1346.5 | -718.5 | |
| 0 | 6 | 0 | 3 | -7.61 | 146.06 | 18.95 | 234.54 | 0.3968 | 453.0 | 319.7 | |
| 0 | 4 | 0 | 2 | -7.16 | 145.87 | 18.76 | 235.22 | 0.3902 | 569.0 | 497.0 | |
| 0 | 4 | 0 | 2 | -7.88 | 145.69 | 18.58 | 233.44 | 0.3947 | -622.0 | -550.9 | |
| 0 | 3 | 0 | 2 | -6.99 | 145.61 | 18.50 | 235.20 | 0.3852 | 759.0 | 622.5 | |
| 3 | 9 | 1 | 5 | -8.86 | 145.53 | 18.42 | 231.24 | 0.4021 | -670.0 | -455.4 | |
| 6 | 19 | 3 | 10 | -8.48 | 145.21 | 18.11 | 231.51 | 0.3944 | -1376.6 | -1011.8 | |
| 0 | 4 | 0 | 2 | -7.78 | 145.01 | 17.90 | 232.62 | 0.3850 | -850.0 | -577.8 | |
| 0 | 6 | 0 | 3 | -8.90 | 144.39 | 17.29 | 229.35 | 0.3886 | -530.0 | -365.3 | |
| 6 | 184 | 3 | 97 | -7.18 | 144.03 | 16.92 | 232.32 | 0.3664 | 1031.9 | 639.9 | |
| 0 | 7 | 0 | 4 | -8.56 | 144.00 | 16.89 | 229.38 | 0.3802 | -1160.0 | -810.8 | |
| 0 | 5 | 0 | 3 | -9.52 | 143.34 | 16.23 | 226.34 | 0.3826 | 912.0 | 657.9 | |
| 15 | -26 | 8 | -26 | -7.07 | 143.11 | 16.00 | 230.98 | 0.3536 | 1588.3 | 999999 | |
| 11 | -26 | 6 | -26 | -7.30 | 142.49 | 15.39 | 229.37 | 0.3483 | 1461.3 | 999999 | |
| 0 | 4 | 0 | 2 | -9.52 | 141.88 | 14.77 | 223.63 | 0.3660 | 968.0 | 743.7 | |
| 0 | 3 | 0 | 2 | -8.09 | 141.78 | 14.67 | 226.31 | 0.3483 | 964.0 | 863.5 | |
| 0 | 5 | 0 | 2 | -8.29 | 141.62 | 14.51 | 225.58 | 0.3487 | 774.0 | 559.4 | |
| 0 | 4 | 0 | 2 | -8.65 | 141.26 | 14.16 | 224.13 | 0.3488 | 876.0 | 632.9 | |
| 7 | 45 | 4 | 24 | -7.87 | 141.15 | 14.05 | 225.51 | 0.3384 | 1525.1 | 1121.3 | |
| 3 | -35 | 1 | -35 | -7.50 | 141.02 | 13.91 | 226.03 | 0.3326 | 1500.2 | 999999 | |
| Proj. U | - Projected umbra area in millionths of solar disc, negative values indicate | |
|
that the umbra consists of fragmented regions which cannot be separated without losing umbral area. In this way several spots (intensity minima in the umbra) have a common umbra, e.g. -2 means that the given spot shares an umbra with spot No.2, and the common U value is indicated at spot No.2. |
||
| Proj. WS | - Projected whole spot area in millionths of solar disc, negative values indicate | |
|
that several umbras have a common penumbra, e.g. -7 means that the given umbra shares a penumbra with umbra No.7, and the WS value is indicated at No.7. |
||
| Corr. U | - Corrected umbra area in millionths of solar hemisphere, for negative values see above | |
| Corr. WS | - Corrected whole spot area in millionths of solar hemisphere, for negative values see above | |
| B | - Heliographic latitude B; positive: North, negative: South | |
| L | - Heliographic longitude L | |
| LCM | - Longitudinal distance from the Sun's central meridian | |
| Pos. angle | - Position angle | |
| r | - Distance from the centre of Sun's disc in terms of Sun's radius | |
| MU | - Mean magnetic field within the umbra contour averaged the pixel values with sign. | |
| MP | - Mean magnetic field within the penumbra contour averaged the pixel values with sign. | |