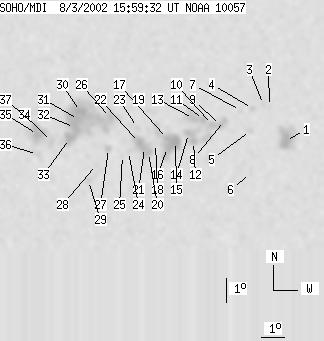
SOHO MDI 2002-08-03 15:59:32 UT
| group | Proj. U | Proj. WS | Corr. U | Corr. WS | B | L | LCM | Pos. angle | r | MU | MP |
| 147 | 698 | 78 | 381 | -7.89 | 145.50 | 20.16 | 235.23 | 0.4157 | -229.5 | -5.5 | |
|
previous
or next observation for the same group /
back to the solar disc SOHO MDI 2002-08-03 15:59:32 UT |
| spot | Proj. U | Proj. WS | Corr. U | Corr. WS | B | L | LCM | Pos. angle | r | MU | MP |
| 17 | 59 | 10 | 34 | -8.44 | 151.79 | 26.45 | 241.60 | 0.5029 | -1315.7 | -708.2 | |
| 0 | 4 | 0 | 2 | -7.02 | 150.99 | 25.64 | 243.43 | 0.4822 | 629.0 | 469.6 | |
| 0 | 5 | 0 | 3 | -6.93 | 150.72 | 25.37 | 243.36 | 0.4778 | 896.0 | 611.9 | |
| 0 | 5 | 0 | 3 | -7.07 | 150.24 | 24.90 | 242.64 | 0.4723 | 902.0 | 672.8 | |
| 0 | 4 | 0 | 2 | -7.96 | 150.21 | 24.86 | 240.94 | 0.4783 | -318.0 | -373.1 | |
| 0 | 8 | 0 | 5 | -9.72 | 150.34 | 24.99 | 237.92 | 0.4935 | -790.0 | -326.2 | |
| 0 | 4 | 0 | 2 | -7.13 | 149.72 | 24.37 | 242.02 | 0.4656 | 124.0 | 84.1 | |
| 2 | 118 | 1 | 65 | -7.50 | 149.04 | 23.70 | 240.61 | 0.4592 | -923.6 | -649.8 | |
| 4 | -8 | 2 | -8 | -7.70 | 148.88 | 23.53 | 240.06 | 0.4585 | -1081.7 | 999999 | |
| 4 | -8 | 2 | -8 | -7.64 | 148.53 | 23.18 | 239.79 | 0.4533 | -1162.3 | 999999 | |
| 4 | -8 | 2 | -8 | -7.42 | 148.12 | 22.78 | 239.77 | 0.4462 | -1131.2 | 999999 | |
| 4 | -8 | 2 | -8 | -8.30 | 147.74 | 22.40 | 237.64 | 0.4482 | 77.9 | 999999 | |
| 6 | -8 | 3 | -8 | -7.37 | 147.69 | 22.34 | 239.39 | 0.4399 | -1277.9 | 999999 | |
| 5 | -8 | 3 | -8 | -7.97 | 147.50 | 22.16 | 238.00 | 0.4423 | -1082.6 | 999999 | |
| 15 | 81 | 8 | 44 | -8.27 | 146.96 | 21.62 | 236.76 | 0.4377 | -1245.5 | -658.3 | |
| 7 | -15 | 4 | -15 | -8.50 | 146.63 | 21.29 | 235.91 | 0.4354 | -1195.5 | 999999 | |
| 5 | -15 | 3 | -15 | -8.14 | 146.61 | 21.27 | 236.59 | 0.4320 | -1567.1 | 999999 | |
| 0 | 2 | 0 | 1 | -8.32 | 146.11 | 20.76 | 235.59 | 0.4270 | -671.0 | -554.2 | |
| 0 | 11 | 0 | 6 | -6.97 | 145.78 | 20.44 | 237.89 | 0.4110 | 536.0 | 386.7 | |
| 4 | 48 | 2 | 26 | -8.68 | 145.83 | 20.48 | 234.53 | 0.4266 | -711.9 | -833.0 | |
| 4 | -20 | 2 | -20 | -8.47 | 145.65 | 20.30 | 234.69 | 0.4223 | -1302.4 | 999999 | |
| 7 | -20 | 4 | -20 | -8.25 | 145.42 | 20.08 | 234.81 | 0.4175 | -1611.9 | 999999 | |
| 0 | 12 | 0 | 7 | -7.64 | 145.30 | 19.96 | 235.88 | 0.4104 | -617.0 | -509.5 | |
| 0 | 3 | 0 | 2 | -8.60 | 144.97 | 19.63 | 233.50 | 0.4150 | -408.0 | -422.9 | |
| 0 | 4 | 0 | 2 | -8.76 | 144.73 | 19.38 | 232.84 | 0.4133 | -612.0 | -433.5 | |
| 5 | 232 | 3 | 124 | -7.19 | 144.14 | 18.80 | 235.18 | 0.3911 | 791.3 | 668.2 | |
| 3 | 8 | 1 | 5 | -8.45 | 144.12 | 18.77 | 232.56 | 0.4026 | -942.0 | -638.9 | |
| 0 | 3 | 0 | 2 | -9.09 | 143.64 | 18.30 | 230.59 | 0.4030 | -357.0 | -400.7 | |
| 0 | 13 | 0 | 7 | -9.74 | 143.34 | 18.00 | 228.88 | 0.4059 | 967.0 | 513.9 | |
| 8 | -26 | 4 | -26 | -6.91 | 142.87 | 17.53 | 233.88 | 0.3717 | 1640.8 | 999999 | |
| 9 | -26 | 5 | -26 | -7.23 | 142.80 | 17.46 | 233.07 | 0.3739 | 1566.5 | 999999 | |
| 11 | -26 | 6 | -26 | -7.55 | 142.65 | 17.30 | 232.14 | 0.3751 | 1384.7 | 999999 | |
| 12 | -26 | 6 | -26 | -7.99 | 142.46 | 17.11 | 230.90 | 0.3771 | 1131.1 | 999999 | |
| 0 | 10 | 0 | 5 | -8.09 | 141.71 | 16.37 | 229.43 | 0.3689 | 1219.0 | 986.4 | |
| 6 | 49 | 3 | 26 | -7.79 | 141.12 | 15.77 | 229.01 | 0.3584 | 1642.1 | 989.8 | |
| 0 | 15 | 0 | 8 | -8.60 | 141.15 | 15.81 | 227.38 | 0.3676 | 774.0 | 333.0 | |
| 5 | -35 | 2 | -35 | -7.46 | 141.02 | 15.68 | 229.54 | 0.3537 | 1393.8 | 999999 | |
| Proj. U | - Projected umbra area in millionths of solar disc, negative values indicate | |
|
that the umbra consists of fragmented regions which cannot be separated without losing umbral area. In this way several spots (intensity minima in the umbra) have a common umbra, e.g. -2 means that the given spot shares an umbra with spot No.2, and the common U value is indicated at spot No.2. |
||
| Proj. WS | - Projected whole spot area in millionths of solar disc, negative values indicate | |
|
that several umbras have a common penumbra, e.g. -7 means that the given umbra shares a penumbra with umbra No.7, and the WS value is indicated at No.7. |
||
| Corr. U | - Corrected umbra area in millionths of solar hemisphere, for negative values see above | |
| Corr. WS | - Corrected whole spot area in millionths of solar hemisphere, for negative values see above | |
| B | - Heliographic latitude B; positive: North, negative: South | |
| L | - Heliographic longitude L | |
| LCM | - Longitudinal distance from the Sun's central meridian | |
| Pos. angle | - Position angle | |
| r | - Distance from the centre of Sun's disc in terms of Sun's radius | |
| MU | - Mean magnetic field within the umbra contour averaged the pixel values with sign. | |
| MP | - Mean magnetic field within the penumbra contour averaged the pixel values with sign. | |