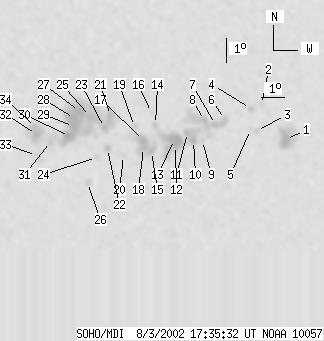
SOHO MDI 2002-08-03 17:35:32 UT
| group | Proj. U | Proj. WS | Corr. U | Corr. WS | B | L | LCM | Pos. angle | r | MU | MP |
| 142 | 713 | 77 | 391 | -7.80 | 145.42 | 20.96 | 236.48 | 0.4254 | -9.9 | -21.6 | |
|
previous
or next observation for the same group /
back to the solar disc SOHO MDI 2002-08-03 17:35:32 UT |
| spot | Proj. U | Proj. WS | Corr. U | Corr. WS | B | L | LCM | Pos. angle | r | MU | MP |
| 16 | 61 | 9 | 35 | -8.41 | 151.90 | 27.44 | 242.54 | 0.5157 | -1292.8 | -616.0 | |
| 0 | 5 | 0 | 3 | -6.93 | 150.72 | 26.26 | 244.16 | 0.4900 | 809.0 | 603.4 | |
| 0 | 4 | 0 | 2 | -7.98 | 150.57 | 26.10 | 242.10 | 0.4950 | -664.0 | -480.5 | |
| 2 | 6 | 1 | 4 | -7.07 | 150.24 | 25.78 | 243.47 | 0.4844 | 747.0 | 501.6 | |
| 0 | 3 | 0 | 1 | -7.92 | 150.30 | 25.83 | 241.95 | 0.4910 | -784.0 | -597.6 | |
| 2 | 74 | 1 | 41 | -7.46 | 149.16 | 24.70 | 241.70 | 0.4725 | -946.5 | -844.1 | |
| 5 | -6 | 3 | -6 | -7.65 | 148.73 | 24.27 | 240.93 | 0.4681 | -1077.7 | 999999 | |
| 4 | -6 | 2 | -6 | -7.46 | 148.24 | 23.78 | 240.77 | 0.4601 | -1193.8 | 999999 | |
| 0 | 5 | 0 | 3 | -8.28 | 148.21 | 23.74 | 239.19 | 0.4658 | 181.0 | 205.0 | |
| 5 | 32 | 3 | 18 | -8.26 | 147.81 | 23.35 | 238.80 | 0.4605 | 33.6 | -641.2 | |
| 4 | -10 | 2 | -10 | -7.92 | 147.53 | 23.07 | 239.12 | 0.4540 | -1146.2 | 999999 | |
| 4 | 69 | 2 | 38 | -8.43 | 147.04 | 22.58 | 237.60 | 0.4517 | -1059.2 | -874.2 | |
| 15 | -12 | 8 | -12 | -8.18 | 146.98 | 22.52 | 238.00 | 0.4489 | -1451.4 | 999999 | |
| 0 | 9 | 0 | 5 | -7.54 | 146.13 | 21.66 | 238.25 | 0.4322 | 450.0 | 164.4 | |
| 5 | 72 | 3 | 40 | -8.63 | 146.02 | 21.56 | 235.98 | 0.4400 | -779.5 | -757.1 | |
| 0 | 2 | 0 | 1 | -7.04 | 145.93 | 21.47 | 239.00 | 0.4255 | 644.0 | 564.7 | |
| 9 | -15 | 5 | -15 | -8.17 | 145.65 | 21.18 | 236.41 | 0.4312 | -1576.1 | 999999 | |
| 3 | -15 | 2 | -15 | -8.46 | 145.66 | 21.20 | 235.88 | 0.4339 | -1351.9 | 999999 | |
| 0 | 5 | 0 | 3 | -7.58 | 145.23 | 20.77 | 237.04 | 0.4207 | -781.0 | -733.8 | |
| 0 | 4 | 0 | 2 | -8.75 | 144.82 | 20.36 | 234.21 | 0.4257 | -438.0 | -424.7 | |
| 6 | 275 | 3 | 148 | -7.10 | 144.19 | 19.72 | 236.66 | 0.4026 | 899.0 | 591.5 | |
| 4 | 8 | 2 | 5 | -8.44 | 144.12 | 19.66 | 233.86 | 0.4139 | -976.0 | -603.2 | |
| 4 | -21 | 2 | -21 | -7.58 | 143.95 | 19.49 | 235.35 | 0.4038 | 683.3 | 999999 | |
| 0 | 4 | 0 | 2 | -8.79 | 143.68 | 19.22 | 232.53 | 0.4115 | -805.0 | -582.0 | |
| 6 | -21 | 3 | -21 | -7.11 | 143.34 | 18.88 | 235.46 | 0.3915 | 1154.8 | 999999 | |
| 0 | 6 | 0 | 3 | -9.80 | 143.35 | 18.89 | 230.12 | 0.4175 | 996.0 | 784.8 | |
| 10 | -21 | 5 | -21 | -6.89 | 142.87 | 18.41 | 235.25 | 0.3832 | 1718.2 | 999999 | |
| 5 | -21 | 3 | -21 | -7.17 | 142.67 | 18.21 | 234.35 | 0.3832 | 1908.7 | 999999 | |
| 13 | -21 | 7 | -21 | -7.49 | 142.64 | 18.18 | 233.63 | 0.3859 | 1396.1 | 999999 | |
| 11 | -21 | 6 | -21 | -7.89 | 142.49 | 18.03 | 232.56 | 0.3878 | 1299.1 | 999999 | |
| 0 | 15 | 0 | 8 | -8.07 | 141.70 | 17.24 | 230.93 | 0.3796 | 1197.0 | 1027.6 | |
| 6 | 45 | 3 | 24 | -7.77 | 141.11 | 16.65 | 230.57 | 0.3690 | 1617.7 | 1019.4 | |
| 0 | 9 | 0 | 5 | -8.63 | 141.14 | 16.68 | 228.87 | 0.3785 | 752.0 | 629.2 | |
| 3 | -32 | 2 | -32 | -7.48 | 141.05 | 16.59 | 231.09 | 0.3654 | 1446.0 | 999999 | |
| Proj. U | - Projected umbra area in millionths of solar disc, negative values indicate | |
|
that the umbra consists of fragmented regions which cannot be separated without losing umbral area. In this way several spots (intensity minima in the umbra) have a common umbra, e.g. -2 means that the given spot shares an umbra with spot No.2, and the common U value is indicated at spot No.2. |
||
| Proj. WS | - Projected whole spot area in millionths of solar disc, negative values indicate | |
|
that several umbras have a common penumbra, e.g. -7 means that the given umbra shares a penumbra with umbra No.7, and the WS value is indicated at No.7. |
||
| Corr. U | - Corrected umbra area in millionths of solar hemisphere, for negative values see above | |
| Corr. WS | - Corrected whole spot area in millionths of solar hemisphere, for negative values see above | |
| B | - Heliographic latitude B; positive: North, negative: South | |
| L | - Heliographic longitude L | |
| LCM | - Longitudinal distance from the Sun's central meridian | |
| Pos. angle | - Position angle | |
| r | - Distance from the centre of Sun's disc in terms of Sun's radius | |
| MU | - Mean magnetic field within the umbra contour averaged the pixel values with sign. | |
| MP | - Mean magnetic field within the penumbra contour averaged the pixel values with sign. | |