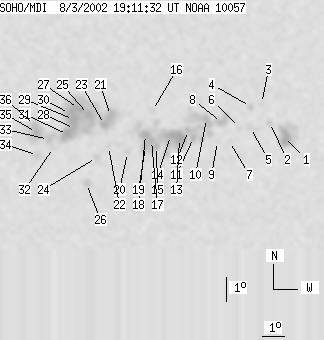
SOHO MDI 2002-08-03 19:11:32 UT
| group | Proj. U | Proj. WS | Corr. U | Corr. WS | B | L | LCM | Pos. angle | r | MU | MP |
| 159 | 790 | 88 | 436 | -7.86 | 145.61 | 22.03 | 237.69 | 0.4400 | 46.8 | -36.8 | |
|
previous
or next observation for the same group /
back to the solar disc SOHO MDI 2002-08-03 19:11:32 UT |
| spot | Proj. U | Proj. WS | Corr. U | Corr. WS | B | L | LCM | Pos. angle | r | MU | MP |
| 19 | 62 | 11 | 36 | -8.36 | 151.92 | 28.34 | 243.37 | 0.5275 | -1230.6 | -521.3 | |
| 0 | 6 | 0 | 3 | -7.76 | 151.19 | 27.61 | 243.81 | 0.5138 | -792.0 | -774.6 | |
| 0 | 4 | 0 | 2 | -6.97 | 150.78 | 27.20 | 244.88 | 0.5031 | 705.0 | 577.3 | |
| 0 | 7 | 0 | 4 | -7.06 | 150.29 | 26.71 | 244.29 | 0.4971 | 710.0 | 515.9 | |
| 0 | 10 | 0 | 6 | -7.92 | 150.35 | 26.77 | 242.80 | 0.5036 | -423.0 | -517.3 | |
| 0 | 8 | 0 | 5 | -7.90 | 149.86 | 26.28 | 242.40 | 0.4969 | -611.0 | -470.6 | |
| 0 | 3 | 0 | 2 | -8.45 | 149.45 | 25.87 | 241.03 | 0.4954 | 270.0 | 254.6 | |
| 4 | 314 | 3 | 175 | -7.66 | 149.04 | 25.46 | 242.08 | 0.4842 | -1094.1 | -683.6 | |
| 0 | 4 | 0 | 2 | -8.42 | 148.92 | 25.34 | 240.56 | 0.4881 | -419.0 | -264.9 | |
| 4 | -8 | 2 | -8 | -7.46 | 148.37 | 24.79 | 241.78 | 0.4737 | -1251.4 | 999999 | |
| 3 | -8 | 2 | -8 | -8.21 | 147.85 | 24.27 | 239.86 | 0.4723 | 46.4 | 999999 | |
| 2 | -8 | 1 | -8 | -7.92 | 147.61 | 24.03 | 240.16 | 0.4669 | -1112.5 | 999999 | |
| 18 | -8 | 10 | -8 | -8.23 | 147.23 | 23.65 | 239.18 | 0.4643 | -1272.5 | 999999 | |
| 9 | -8 | 5 | -8 | -8.09 | 146.83 | 23.25 | 239.01 | 0.4578 | -1601.3 | 999999 | |
| 4 | -8 | 2 | -8 | -8.51 | 146.25 | 22.67 | 237.55 | 0.4536 | -756.3 | 999999 | |
| 0 | 5 | 0 | 3 | -7.04 | 145.99 | 22.41 | 240.11 | 0.4383 | 322.0 | 414.6 | |
| 4 | -8 | 2 | -8 | -8.26 | 146.02 | 22.44 | 237.76 | 0.4485 | -1377.3 | 999999 | |
| 8 | -8 | 4 | -8 | -8.00 | 145.74 | 22.16 | 237.93 | 0.4427 | -1575.2 | 999999 | |
| 3 | -8 | 2 | -8 | -8.49 | 145.77 | 22.19 | 237.03 | 0.4472 | -1072.1 | 999999 | |
| 0 | 7 | 0 | 4 | -8.71 | 145.01 | 21.43 | 235.68 | 0.4391 | -625.0 | -474.5 | |
| 9 | 254 | 5 | 137 | -7.17 | 144.20 | 20.62 | 237.69 | 0.4152 | 496.5 | 621.0 | |
| 0 | 4 | 0 | 2 | -8.43 | 144.18 | 20.60 | 235.15 | 0.4259 | -630.0 | -479.3 | |
| 7 | -21 | 4 | -21 | -7.52 | 143.96 | 20.38 | 236.66 | 0.4151 | 683.0 | 999999 | |
| 0 | 4 | 0 | 2 | -8.86 | 143.69 | 20.11 | 233.66 | 0.4236 | -954.0 | -742.2 | |
| 6 | -21 | 3 | -21 | -7.09 | 143.26 | 19.68 | 236.61 | 0.4020 | 1212.1 | 999999 | |
| 0 | 8 | 0 | 4 | -9.91 | 143.33 | 19.75 | 231.17 | 0.4291 | 1183.0 | 817.6 | |
| 10 | -21 | 6 | -21 | -6.83 | 142.83 | 19.25 | 236.56 | 0.3939 | 1651.9 | 999999 | |
| 5 | -21 | 3 | -21 | -7.64 | 142.69 | 19.12 | 234.69 | 0.3995 | 1213.2 | 999999 | |
| 12 | -21 | 6 | -21 | -7.27 | 142.64 | 19.06 | 235.36 | 0.3953 | 1669.4 | 999999 | |
| 7 | -21 | 4 | -21 | -7.02 | 142.46 | 18.88 | 235.64 | 0.3907 | 1929.0 | 999999 | |
| 15 | -21 | 8 | -21 | -7.88 | 142.41 | 18.83 | 233.79 | 0.3979 | 1282.7 | 999999 | |
| 0 | 5 | 0 | 3 | -8.39 | 141.84 | 18.27 | 231.91 | 0.3957 | 689.0 | 575.1 | |
| 2 | 22 | 1 | 12 | -8.05 | 141.62 | 18.04 | 232.24 | 0.3895 | 1261.4 | 995.1 | |
| 0 | 9 | 0 | 5 | -8.69 | 141.19 | 17.61 | 230.27 | 0.3905 | 726.0 | 521.6 | |
| 6 | 54 | 3 | 29 | -7.75 | 141.10 | 17.52 | 232.05 | 0.3800 | 1641.9 | 876.6 | |
| 2 | -35 | 1 | -35 | -7.46 | 141.01 | 17.43 | 232.50 | 0.3759 | 1425.6 | 999999 | |
| Proj. U | - Projected umbra area in millionths of solar disc, negative values indicate | |
|
that the umbra consists of fragmented regions which cannot be separated without losing umbral area. In this way several spots (intensity minima in the umbra) have a common umbra, e.g. -2 means that the given spot shares an umbra with spot No.2, and the common U value is indicated at spot No.2. |
||
| Proj. WS | - Projected whole spot area in millionths of solar disc, negative values indicate | |
|
that several umbras have a common penumbra, e.g. -7 means that the given umbra shares a penumbra with umbra No.7, and the WS value is indicated at No.7. |
||
| Corr. U | - Corrected umbra area in millionths of solar hemisphere, for negative values see above | |
| Corr. WS | - Corrected whole spot area in millionths of solar hemisphere, for negative values see above | |
| B | - Heliographic latitude B; positive: North, negative: South | |
| L | - Heliographic longitude L | |
| LCM | - Longitudinal distance from the Sun's central meridian | |
| Pos. angle | - Position angle | |
| r | - Distance from the centre of Sun's disc in terms of Sun's radius | |
| MU | - Mean magnetic field within the umbra contour averaged the pixel values with sign. | |
| MP | - Mean magnetic field within the penumbra contour averaged the pixel values with sign. | |