SOHO MDI 2002-08-03 20:47:32 UT
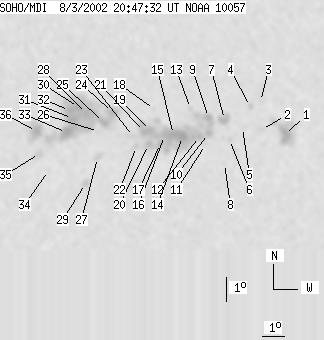
| group | Proj. U | Proj. WS | Corr. U | Corr. WS | B | L | LCM | Pos. angle | r | MU | MP |
| 144 | 794 | 80 | 442 | -7.81 | 145.70 | 23.01 | 238.96 | 0.4524 | 57.8 | -56.3 | |
|
previous
or next observation for the same group /
back to the solar disc SOHO MDI 2002-08-03 20:47:32 UT |
| spot | Proj. U | Proj. WS | Corr. U | Corr. WS | B | L | LCM | Pos. angle | r | MU | MP |
| 17 | 65 | 10 | 38 | -8.33 | 151.99 | 29.30 | 244.19 | 0.5399 | -1169.3 | -572.9 | |
| 0 | 6 | 0 | 4 | -8.07 | 150.92 | 28.23 | 243.78 | 0.5240 | -738.0 | -696.9 | |
| 0 | 3 | 0 | 2 | -6.92 | 150.80 | 28.10 | 245.68 | 0.5151 | 573.0 | 570.3 | |
| 0 | 5 | 0 | 3 | -7.10 | 150.36 | 27.66 | 245.00 | 0.5103 | 619.0 | 526.8 | |
| 0 | 7 | 0 | 4 | -7.94 | 150.05 | 27.36 | 243.26 | 0.5116 | -530.0 | -390.6 | |
| 0 | 4 | 0 | 3 | -8.40 | 149.50 | 26.81 | 241.97 | 0.5075 | 404.0 | 423.9 | |
| 9 | 19 | 5 | 11 | -7.58 | 149.22 | 26.52 | 243.19 | 0.4980 | -1069.2 | -767.6 | |
| 0 | 4 | 0 | 2 | -9.38 | 149.36 | 26.66 | 240.14 | 0.5125 | 83.0 | 219.8 | |
| 5 | 297 | 3 | 167 | -7.46 | 148.50 | 25.81 | 242.75 | 0.4875 | -1276.0 | -712.5 | |
| 4 | -9 | 2 | -9 | -8.11 | 148.55 | 25.85 | 241.60 | 0.4927 | 154.5 | 999999 | |
| 0 | 2 | 0 | 1 | -8.56 | 148.44 | 25.75 | 240.71 | 0.4945 | -394.0 | -300.9 | |
| 4 | -9 | 2 | -9 | -8.22 | 148.15 | 25.46 | 241.04 | 0.4882 | 467.0 | 999999 | |
| 0 | 3 | 0 | 2 | -7.06 | 147.68 | 24.99 | 242.73 | 0.4736 | -929.0 | -718.4 | |
| 9 | -9 | 5 | -9 | -8.18 | 147.40 | 24.70 | 240.35 | 0.4779 | -1511.8 | 999999 | |
| 5 | -9 | 3 | -9 | -8.08 | 147.00 | 24.30 | 240.12 | 0.4718 | -1770.4 | 999999 | |
| 4 | -9 | 2 | -9 | -8.11 | 146.61 | 23.91 | 239.67 | 0.4668 | -1358.3 | 999999 | |
| 4 | -9 | 2 | -9 | -8.43 | 146.45 | 23.76 | 238.91 | 0.4672 | -858.0 | 999999 | |
| 0 | 4 | 0 | 2 | -7.03 | 146.11 | 23.41 | 241.20 | 0.4519 | 629.0 | 432.7 | |
| 5 | -9 | 3 | -9 | -7.88 | 145.98 | 23.28 | 239.43 | 0.4567 | -1608.2 | 999999 | |
| 4 | -9 | 2 | -9 | -8.45 | 145.93 | 23.23 | 238.30 | 0.4605 | -1174.3 | 999999 | |
| 5 | -9 | 3 | -9 | -7.91 | 145.72 | 23.03 | 239.09 | 0.4534 | -1352.8 | 999999 | |
| 0 | 6 | 0 | 3 | -8.51 | 145.41 | 22.72 | 237.60 | 0.4542 | -728.0 | -673.1 | |
| 0 | 12 | 0 | 7 | -8.09 | 145.26 | 22.56 | 238.21 | 0.4487 | -405.0 | -325.8 | |
| 5 | 281 | 3 | 153 | -7.08 | 144.30 | 21.60 | 239.07 | 0.4276 | 779.9 | 683.6 | |
| 6 | -24 | 3 | -24 | -7.47 | 143.93 | 21.23 | 237.84 | 0.4260 | 685.7 | 999999 | |
| 0 | 3 | 0 | 2 | -7.83 | 143.74 | 21.04 | 236.89 | 0.4264 | 232.0 | 207.7 | |
| 0 | 7 | 0 | 4 | -8.89 | 143.75 | 21.06 | 234.85 | 0.4359 | -535.0 | -467.2 | |
| 8 | -24 | 4 | -24 | -7.07 | 143.19 | 20.49 | 237.71 | 0.4127 | 1313.5 | 999999 | |
| 0 | 8 | 0 | 4 | -9.94 | 143.31 | 20.61 | 232.31 | 0.4399 | 1119.0 | 812.3 | |
| 8 | -24 | 4 | -24 | -6.82 | 142.83 | 20.14 | 237.78 | 0.4058 | 1704.3 | 999999 | |
| 7 | -24 | 4 | -24 | -7.26 | 142.60 | 19.90 | 236.56 | 0.4064 | 1699.8 | 999999 | |
| 8 | -24 | 5 | -24 | -6.93 | 142.46 | 19.76 | 237.06 | 0.4016 | 1857.5 | 999999 | |
| 15 | -24 | 8 | -24 | -7.82 | 142.37 | 19.67 | 235.10 | 0.4084 | 1197.4 | 999999 | |
| 0 | 3 | 0 | 1 | -9.34 | 141.69 | 18.99 | 231.13 | 0.4142 | 668.0 | 542.9 | |
| 0 | 12 | 0 | 6 | -8.63 | 141.27 | 18.57 | 231.88 | 0.4020 | 1006.0 | 513.4 | |
| 12 | 43 | 7 | 23 | -7.73 | 141.10 | 18.40 | 233.45 | 0.3911 | 1516.9 | 843.9 | |
| Proj. U | - Projected umbra area in millionths of solar disc, negative values indicate | |
|
that the umbra consists of fragmented regions which cannot be separated without losing umbral area. In this way several spots (intensity minima in the umbra) have a common umbra, e.g. -2 means that the given spot shares an umbra with spot No.2, and the common U value is indicated at spot No.2. |
||
| Proj. WS | - Projected whole spot area in millionths of solar disc, negative values indicate | |
|
that several umbras have a common penumbra, e.g. -7 means that the given umbra shares a penumbra with umbra No.7, and the WS value is indicated at No.7. |
||
| Corr. U | - Corrected umbra area in millionths of solar hemisphere, for negative values see above | |
| Corr. WS | - Corrected whole spot area in millionths of solar hemisphere, for negative values see above | |
| B | - Heliographic latitude B; positive: North, negative: South | |
| L | - Heliographic longitude L | |
| LCM | - Longitudinal distance from the Sun's central meridian | |
| Pos. angle | - Position angle | |
| r | - Distance from the centre of Sun's disc in terms of Sun's radius | |
| MU | - Mean magnetic field within the umbra contour averaged the pixel values with sign. | |
| MP | - Mean magnetic field within the penumbra contour averaged the pixel values with sign. | |