SOHO MDI 2002-08-03 23:59:32 UT
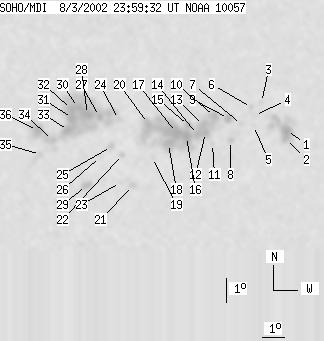
| group | Proj. U | Proj. WS | Corr. U | Corr. WS | B | L | LCM | Pos. angle | r | MU | MP |
| 152 | 814 | 84 | 461 | -7.79 | 146.02 | 25.09 | 241.15 | 0.4801 | -10.1 | -71.0 | |
|
previous
or next observation for the same group /
back to the solar disc SOHO MDI 2002-08-03 23:59:32 UT |
| spot | Proj. U | Proj. WS | Corr. U | Corr. WS | B | L | LCM | Pos. angle | r | MU | MP |
| 9 | 76 | 5 | 46 | -8.18 | 152.21 | 31.27 | 245.89 | 0.5651 | -1219.9 | -646.7 | |
| 5 | -1 | 3 | -1 | -8.51 | 152.19 | 31.25 | 245.35 | 0.5668 | -948.9 | 999999 | |
| 0 | 4 | 0 | 2 | -6.98 | 150.95 | 30.02 | 247.01 | 0.5415 | 614.0 | 545.2 | |
| 0 | 7 | 0 | 4 | -7.49 | 150.66 | 29.73 | 245.93 | 0.5406 | -467.0 | -372.2 | |
| 0 | 3 | 0 | 2 | -7.89 | 150.65 | 29.72 | 245.23 | 0.5429 | -676.0 | -475.3 | |
| 0 | 4 | 0 | 3 | -7.16 | 150.50 | 29.57 | 246.38 | 0.5365 | 692.0 | 419.9 | |
| 0 | 6 | 0 | 3 | -7.82 | 150.09 | 29.16 | 244.93 | 0.5350 | -646.0 | -501.1 | |
| 0 | 7 | 0 | 4 | -8.45 | 149.64 | 28.71 | 243.50 | 0.5330 | 815.0 | 473.8 | |
| 6 | 15 | 3 | 9 | -7.55 | 149.48 | 28.55 | 244.92 | 0.5251 | -1039.6 | -721.5 | |
| 6 | 312 | 4 | 179 | -7.43 | 148.84 | 27.90 | 244.60 | 0.5157 | -1197.0 | -721.9 | |
| 0 | 3 | 0 | 2 | -8.53 | 148.83 | 27.90 | 242.69 | 0.5228 | -607.0 | -454.7 | |
| 6 | -10 | 3 | -10 | -8.07 | 148.48 | 27.54 | 243.19 | 0.5150 | 539.9 | 999999 | |
| 8 | -10 | 5 | -10 | -7.78 | 148.36 | 27.43 | 243.61 | 0.5116 | -1085.3 | 999999 | |
| 6 | -10 | 3 | -10 | -8.13 | 148.12 | 27.19 | 242.77 | 0.5107 | 757.0 | 999999 | |
| 4 | -10 | 2 | -10 | -7.74 | 147.69 | 26.76 | 243.08 | 0.5023 | -999.8 | 999999 | |
| 13 | -10 | 7 | -10 | -8.19 | 147.63 | 26.70 | 242.24 | 0.5046 | -1248.9 | 999999 | |
| 10 | -10 | 6 | -10 | -8.00 | 147.17 | 26.24 | 242.15 | 0.4972 | -1693.0 | 999999 | |
| 9 | -10 | 5 | -10 | -8.44 | 146.85 | 25.91 | 241.07 | 0.4959 | -1188.8 | 999999 | |
| 0 | 4 | 0 | 2 | -8.98 | 146.18 | 25.24 | 239.45 | 0.4911 | -560.0 | -438.7 | |
| 8 | -10 | 4 | -10 | -7.58 | 145.90 | 24.97 | 241.72 | 0.4771 | -1226.2 | 999999 | |
| 0 | 6 | 0 | 3 | -10.09 | 145.38 | 24.45 | 236.67 | 0.4896 | 1071.0 | 789.5 | |
| 0 | 6 | 0 | 3 | -8.79 | 144.84 | 23.91 | 238.39 | 0.4722 | -948.0 | -641.5 | |
| 0 | 3 | 0 | 2 | -9.94 | 144.84 | 23.90 | 236.33 | 0.4815 | 732.0 | 677.4 | |
| 0 | 3 | 0 | 2 | -7.36 | 144.58 | 23.64 | 240.79 | 0.4575 | -221.0 | -71.4 | |
| 0 | 7 | 0 | 4 | -8.45 | 144.34 | 23.40 | 238.48 | 0.4628 | 485.0 | 253.5 | |
| 0 | 4 | 0 | 2 | -8.83 | 143.88 | 22.95 | 237.25 | 0.4600 | -433.0 | -237.4 | |
| 4 | 249 | 2 | 137 | -7.20 | 143.74 | 22.81 | 240.20 | 0.4451 | 565.4 | 654.8 | |
| 13 | -27 | 7 | -27 | -7.10 | 143.22 | 22.29 | 239.82 | 0.4372 | 1361.3 | 999999 | |
| 7 | 15 | 4 | 9 | -10.00 | 143.36 | 22.42 | 234.51 | 0.4633 | 967.6 | 639.9 | |
| 7 | -27 | 4 | -27 | -6.80 | 142.82 | 21.88 | 239.96 | 0.4293 | 1708.2 | 999999 | |
| 8 | -27 | 4 | -27 | -7.23 | 142.58 | 21.65 | 238.80 | 0.4296 | 1735.7 | 999999 | |
| 6 | -27 | 4 | -27 | -6.87 | 142.52 | 21.59 | 239.47 | 0.4258 | 1982.0 | 999999 | |
| 6 | -27 | 3 | -27 | -7.72 | 142.43 | 21.50 | 237.66 | 0.4317 | 1424.2 | 999999 | |
| 2 | 72 | 1 | 39 | -8.10 | 141.77 | 20.84 | 236.08 | 0.4262 | 1120.8 | 869.4 | |
| 0 | 8 | 0 | 4 | -8.65 | 141.29 | 20.35 | 234.37 | 0.4249 | 995.0 | 666.8 | |
| 9 | -34 | 5 | -34 | -7.66 | 141.11 | 20.17 | 236.07 | 0.4137 | 1491.6 | 999999 | |
| Proj. U | - Projected umbra area in millionths of solar disc, negative values indicate | |
|
that the umbra consists of fragmented regions which cannot be separated without losing umbral area. In this way several spots (intensity minima in the umbra) have a common umbra, e.g. -2 means that the given spot shares an umbra with spot No.2, and the common U value is indicated at spot No.2. |
||
| Proj. WS | - Projected whole spot area in millionths of solar disc, negative values indicate | |
|
that several umbras have a common penumbra, e.g. -7 means that the given umbra shares a penumbra with umbra No.7, and the WS value is indicated at No.7. |
||
| Corr. U | - Corrected umbra area in millionths of solar hemisphere, for negative values see above | |
| Corr. WS | - Corrected whole spot area in millionths of solar hemisphere, for negative values see above | |
| B | - Heliographic latitude B; positive: North, negative: South | |
| L | - Heliographic longitude L | |
| LCM | - Longitudinal distance from the Sun's central meridian | |
| Pos. angle | - Position angle | |
| r | - Distance from the centre of Sun's disc in terms of Sun's radius | |
| MU | - Mean magnetic field within the umbra contour averaged the pixel values with sign. | |
| MP | - Mean magnetic field within the penumbra contour averaged the pixel values with sign. | |