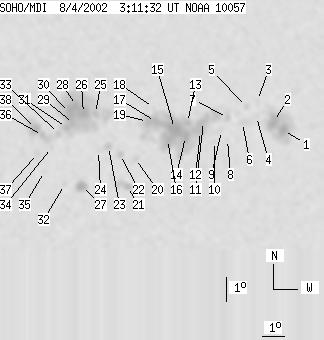
SOHO MDI 2002-08-04 03:11:32 UT
| group | Proj. U | Proj. WS | Corr. U | Corr. WS | B | L | LCM | Pos. angle | r | MU | MP |
| 181 | 887 | 104 | 511 | -7.84 | 146.38 | 27.22 | 243.06 | 0.5090 | -174.6 | -78.7 | |
|
previous
or next observation for the same group /
back to the solar disc SOHO MDI 2002-08-04 03:11:32 UT |
| spot | Proj. U | Proj. WS | Corr. U | Corr. WS | B | L | LCM | Pos. angle | r | MU | MP |
| 12 | 121 | 7 | 74 | -8.25 | 152.39 | 33.22 | 247.07 | 0.5909 | -1081.8 | -537.8 | |
| 15 | -1 | 9 | -1 | -7.85 | 151.87 | 32.70 | 247.37 | 0.5821 | -1311.6 | 999999 | |
| 0 | 6 | 0 | 3 | -6.95 | 151.04 | 31.87 | 248.30 | 0.5663 | 709.0 | 505.8 | |
| 0 | 3 | 0 | 2 | -7.60 | 151.05 | 31.88 | 247.24 | 0.5699 | -521.0 | -550.2 | |
| 0 | 4 | 0 | 3 | -7.17 | 150.54 | 31.37 | 247.61 | 0.5608 | 331.0 | 297.1 | |
| 0 | 10 | 0 | 6 | -7.81 | 150.41 | 31.24 | 246.46 | 0.5626 | -820.0 | -576.8 | |
| 0 | 10 | 0 | 6 | -7.57 | 149.69 | 30.52 | 246.36 | 0.5517 | -887.0 | -704.0 | |
| 0 | 2 | 0 | 1 | -8.46 | 149.76 | 30.60 | 244.93 | 0.5580 | 376.0 | 243.4 | |
| 0 | 5 | 0 | 3 | -8.08 | 149.45 | 30.28 | 245.33 | 0.5516 | -665.0 | -390.9 | |
| 0 | 4 | 0 | 2 | -8.51 | 149.17 | 30.00 | 244.40 | 0.5504 | -611.0 | -561.3 | |
| 11 | 347 | 6 | 201 | -7.67 | 148.59 | 29.42 | 245.38 | 0.5376 | -958.9 | -581.1 | |
| 4 | -11 | 3 | -11 | -8.07 | 148.48 | 29.32 | 244.62 | 0.5387 | 836.5 | 999999 | |
| 4 | -11 | 2 | -11 | -7.67 | 147.86 | 28.69 | 244.81 | 0.5279 | -878.4 | 999999 | |
| 11 | -11 | 6 | -11 | -8.24 | 147.81 | 28.64 | 243.80 | 0.5308 | -1043.9 | 999999 | |
| 21 | -11 | 12 | -11 | -7.89 | 147.28 | 28.12 | 243.98 | 0.5215 | -1698.2 | 999999 | |
| 15 | -11 | 9 | -11 | -8.32 | 147.00 | 27.83 | 242.99 | 0.5206 | -1313.8 | 999999 | |
| 7 | -11 | 4 | -11 | -7.56 | 146.40 | 27.24 | 243.82 | 0.5076 | -1563.6 | 999999 | |
| 0 | 1 | 0 | 1 | -6.98 | 146.28 | 27.11 | 244.74 | 0.5021 | 624.0 | 591.4 | |
| 7 | -11 | 4 | -11 | -7.54 | 146.04 | 26.88 | 243.54 | 0.5026 | -1240.6 | 999999 | |
| 0 | 5 | 0 | 3 | -9.03 | 145.62 | 26.45 | 240.52 | 0.5073 | -855.0 | -555.9 | |
| 4 | 19 | 3 | 11 | -10.16 | 145.35 | 26.18 | 238.33 | 0.5124 | 731.8 | 560.8 | |
| 3 | 9 | 1 | 5 | -8.83 | 144.93 | 25.76 | 240.21 | 0.4969 | -574.7 | -389.8 | |
| 3 | 8 | 2 | 5 | -8.48 | 144.37 | 25.21 | 240.29 | 0.4869 | 559.6 | 321.8 | |
| 0 | 4 | 0 | 2 | -8.62 | 143.94 | 24.77 | 239.60 | 0.4823 | 493.0 | 376.4 | |
| 3 | 246 | 2 | 137 | -7.11 | 143.71 | 24.54 | 242.18 | 0.4680 | 860.9 | 594.9 | |
| 13 | -25 | 7 | -25 | -7.08 | 143.19 | 24.02 | 241.70 | 0.4607 | 1354.4 | 999999 | |
| 9 | 21 | 5 | 12 | -10.07 | 143.30 | 24.13 | 236.35 | 0.4855 | 1077.8 | 597.1 | |
| 6 | -25 | 3 | -25 | -6.74 | 142.86 | 23.70 | 242.02 | 0.4538 | 1820.2 | 999999 | |
| 3 | -25 | 2 | -25 | -7.47 | 142.77 | 23.60 | 240.52 | 0.4579 | 1222.9 | 999999 | |
| 16 | -25 | 9 | -25 | -7.02 | 142.57 | 23.41 | 241.19 | 0.4518 | 1933.1 | 999999 | |
| 3 | -25 | 2 | -25 | -7.62 | 142.48 | 23.31 | 239.92 | 0.4551 | 1256.0 | 999999 | |
| 0 | 4 | 0 | 2 | -9.95 | 142.55 | 23.38 | 235.71 | 0.4750 | 402.0 | 442.7 | |
| 0 | 4 | 0 | 2 | -7.85 | 142.14 | 22.97 | 239.11 | 0.4524 | 984.0 | 793.2 | |
| 0 | 3 | 0 | 2 | -8.41 | 141.87 | 22.70 | 237.74 | 0.4534 | 689.0 | 586.4 | |
| 0 | 4 | 0 | 2 | -9.38 | 141.63 | 22.46 | 235.66 | 0.4585 | 615.0 | 475.2 | |
| 3 | 42 | 2 | 23 | -7.90 | 141.45 | 22.29 | 238.22 | 0.4437 | 1079.4 | 1026.8 | |
| 0 | 5 | 0 | 3 | -8.63 | 141.28 | 22.11 | 236.63 | 0.4475 | 1072.0 | 816.3 | |
| 8 | -36 | 4 | -36 | -7.60 | 141.14 | 21.97 | 238.43 | 0.4370 | 1411.8 | 999999 | |
| Proj. U | - Projected umbra area in millionths of solar disc, negative values indicate | |
|
that the umbra consists of fragmented regions which cannot be separated without losing umbral area. In this way several spots (intensity minima in the umbra) have a common umbra, e.g. -2 means that the given spot shares an umbra with spot No.2, and the common U value is indicated at spot No.2. |
||
| Proj. WS | - Projected whole spot area in millionths of solar disc, negative values indicate | |
|
that several umbras have a common penumbra, e.g. -7 means that the given umbra shares a penumbra with umbra No.7, and the WS value is indicated at No.7. |
||
| Corr. U | - Corrected umbra area in millionths of solar hemisphere, for negative values see above | |
| Corr. WS | - Corrected whole spot area in millionths of solar hemisphere, for negative values see above | |
| B | - Heliographic latitude B; positive: North, negative: South | |
| L | - Heliographic longitude L | |
| LCM | - Longitudinal distance from the Sun's central meridian | |
| Pos. angle | - Position angle | |
| r | - Distance from the centre of Sun's disc in terms of Sun's radius | |
| MU | - Mean magnetic field within the umbra contour averaged the pixel values with sign. | |
| MP | - Mean magnetic field within the penumbra contour averaged the pixel values with sign. | |