SOHO MDI 2002-08-04 04:47:32 UT
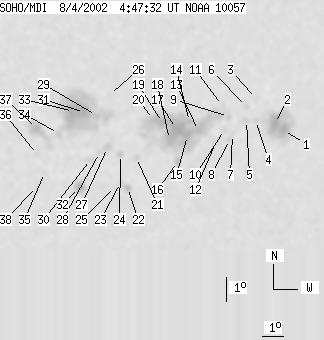
| group | Proj. U | Proj. WS | Corr. U | Corr. WS | B | L | LCM | Pos. angle | r | MU | MP |
| 175 | 936 | 100 | 541 | -7.82 | 146.36 | 28.08 | 243.83 | 0.5203 | -175.0 | -84.3 | |
|
previous
or next observation for the same group /
back to the solar disc SOHO MDI 2002-08-04 04:47:32 UT |
| spot | Proj. U | Proj. WS | Corr. U | Corr. WS | B | L | LCM | Pos. angle | r | MU | MP |
| 15 | 122 | 9 | 75 | -8.26 | 152.47 | 34.18 | 247.64 | 0.6034 | -1035.4 | -541.3 | |
| 19 | -1 | 12 | -1 | -7.95 | 152.00 | 33.71 | 247.85 | 0.5958 | -1392.6 | 999999 | |
| 0 | 6 | 0 | 3 | -6.88 | 151.05 | 32.76 | 248.97 | 0.5778 | 207.0 | 304.5 | |
| 0 | 5 | 0 | 3 | -7.77 | 151.08 | 32.79 | 247.55 | 0.5828 | -735.0 | -524.9 | |
| 0 | 7 | 0 | 4 | -7.74 | 150.65 | 32.36 | 247.31 | 0.5770 | -826.0 | -559.0 | |
| 0 | 4 | 0 | 3 | -7.17 | 150.60 | 32.31 | 248.21 | 0.5734 | 558.0 | 282.1 | |
| 0 | 3 | 0 | 2 | -8.28 | 150.03 | 31.75 | 246.04 | 0.5720 | 167.0 | 123.6 | |
| 0 | 5 | 0 | 3 | -8.48 | 149.91 | 31.62 | 245.64 | 0.5715 | 455.0 | 253.4 | |
| 0 | 8 | 0 | 5 | -7.53 | 149.78 | 31.49 | 247.08 | 0.5645 | -771.0 | -723.1 | |
| 0 | 6 | 0 | 3 | -8.05 | 149.64 | 31.35 | 246.13 | 0.5655 | -631.0 | -584.8 | |
| 0 | 4 | 0 | 2 | -7.07 | 149.46 | 31.18 | 247.64 | 0.5577 | -140.0 | -173.7 | |
| 0 | 5 | 0 | 3 | -8.56 | 149.26 | 30.98 | 245.04 | 0.5635 | -672.0 | -547.4 | |
| 4 | 368 | 2 | 215 | -8.03 | 148.43 | 30.14 | 245.31 | 0.5493 | 1042.5 | -579.1 | |
| 4 | -13 | 2 | -13 | -7.64 | 147.98 | 29.69 | 245.63 | 0.5411 | -836.3 | 999999 | |
| 10 | -13 | 6 | -13 | -8.20 | 147.93 | 29.65 | 244.64 | 0.5439 | -997.3 | 999999 | |
| 3 | -13 | 2 | -13 | -9.25 | 147.56 | 29.28 | 242.62 | 0.5457 | 139.0 | 999999 | |
| 22 | -13 | 13 | -13 | -7.89 | 147.40 | 29.12 | 244.76 | 0.5349 | -1690.6 | 999999 | |
| 11 | -13 | 6 | -13 | -8.32 | 147.12 | 28.83 | 243.80 | 0.5339 | -1281.4 | 999999 | |
| 9 | -13 | 5 | -13 | -7.61 | 146.74 | 28.46 | 244.72 | 0.5244 | -1623.7 | 999999 | |
| 7 | -13 | 4 | -13 | -7.47 | 146.33 | 28.04 | 244.63 | 0.5179 | -1082.2 | 999999 | |
| 0 | 6 | 0 | 3 | -8.99 | 145.67 | 27.39 | 241.45 | 0.5193 | -826.0 | -529.3 | |
| 4 | 9 | 2 | 5 | -10.20 | 145.37 | 27.09 | 239.13 | 0.5242 | 665.5 | 553.0 | |
| 0 | 3 | 0 | 2 | -9.98 | 145.04 | 26.75 | 239.18 | 0.5183 | 562.0 | 547.6 | |
| 2 | 6 | 1 | 4 | -8.83 | 144.94 | 26.65 | 241.06 | 0.5086 | -659.3 | -488.9 | |
| 0 | 4 | 0 | 2 | -10.13 | 144.83 | 26.54 | 238.72 | 0.5167 | 722.0 | 515.4 | |
| 0 | 4 | 0 | 2 | -6.36 | 144.29 | 26.00 | 244.94 | 0.4829 | 630.0 | 515.0 | |
| 2 | 9 | 1 | 5 | -8.51 | 144.34 | 26.05 | 241.04 | 0.4984 | 540.4 | 421.6 | |
| 0 | 4 | 0 | 2 | -8.70 | 143.99 | 25.71 | 240.38 | 0.4952 | 753.0 | 459.1 | |
| 2 | 255 | 1 | 143 | -7.18 | 143.76 | 25.47 | 242.91 | 0.4812 | 804.1 | 567.1 | |
| 0 | 4 | 0 | 2 | -8.97 | 143.61 | 25.33 | 239.53 | 0.4922 | 712.0 | 449.9 | |
| 15 | -29 | 8 | -29 | -7.04 | 143.22 | 24.93 | 242.68 | 0.4729 | 1330.5 | 999999 | |
| 8 | 21 | 5 | 12 | -10.10 | 143.22 | 24.93 | 237.15 | 0.4959 | 1129.2 | 658.6 | |
| 29 | -29 | 16 | -29 | -6.97 | 142.73 | 24.45 | 242.33 | 0.4658 | 1833.8 | 999999 | |
| 0 | 6 | 0 | 3 | -7.84 | 142.13 | 23.84 | 240.06 | 0.4640 | 1102.0 | 752.9 | |
| 0 | 3 | 0 | 2 | -9.41 | 141.62 | 23.34 | 236.61 | 0.4699 | 516.0 | 474.1 | |
| 0 | 5 | 0 | 3 | -8.66 | 141.27 | 22.98 | 237.58 | 0.4591 | 946.0 | 692.7 | |
| 9 | 51 | 5 | 28 | -7.60 | 141.16 | 22.87 | 239.47 | 0.4491 | 1376.8 | 923.3 | |
| 0 | 3 | 0 | 2 | -9.97 | 141.31 | 23.03 | 235.26 | 0.4708 | 811.0 | 719.3 | |
| Proj. U | - Projected umbra area in millionths of solar disc, negative values indicate | |
|
that the umbra consists of fragmented regions which cannot be separated without losing umbral area. In this way several spots (intensity minima in the umbra) have a common umbra, e.g. -2 means that the given spot shares an umbra with spot No.2, and the common U value is indicated at spot No.2. |
||
| Proj. WS | - Projected whole spot area in millionths of solar disc, negative values indicate | |
|
that several umbras have a common penumbra, e.g. -7 means that the given umbra shares a penumbra with umbra No.7, and the WS value is indicated at No.7. |
||
| Corr. U | - Corrected umbra area in millionths of solar hemisphere, for negative values see above | |
| Corr. WS | - Corrected whole spot area in millionths of solar hemisphere, for negative values see above | |
| B | - Heliographic latitude B; positive: North, negative: South | |
| L | - Heliographic longitude L | |
| LCM | - Longitudinal distance from the Sun's central meridian | |
| Pos. angle | - Position angle | |
| r | - Distance from the centre of Sun's disc in terms of Sun's radius | |
| MU | - Mean magnetic field within the umbra contour averaged the pixel values with sign. | |
| MP | - Mean magnetic field within the penumbra contour averaged the pixel values with sign. | |