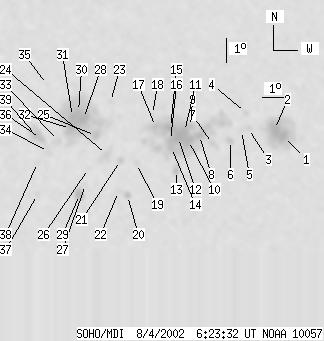
SOHO MDI 2002-08-04 06:23:32 UT
| group | Proj. U | Proj. WS | Corr. U | Corr. WS | B | L | LCM | Pos. angle | r | MU | MP |
| 171 | 931 | 99 | 547 | -7.84 | 146.52 | 29.12 | 244.62 | 0.5343 | -142.1 | -87.4 | |
|
previous
or next observation for the same group /
back to the solar disc SOHO MDI 2002-08-04 06:23:32 UT |
| spot | Proj. U | Proj. WS | Corr. U | Corr. WS | B | L | LCM | Pos. angle | r | MU | MP |
| 12 | 140 | 7 | 88 | -8.23 | 152.55 | 35.15 | 248.25 | 0.6157 | -1043.0 | -551.3 | |
| 16 | -1 | 10 | -1 | -7.92 | 152.08 | 34.68 | 248.46 | 0.6081 | -1521.7 | 999999 | |
| 0 | 5 | 0 | 3 | -7.80 | 150.82 | 33.41 | 247.88 | 0.5911 | -585.0 | -448.9 | |
| 0 | 4 | 0 | 2 | -7.14 | 150.62 | 33.21 | 248.81 | 0.5851 | 144.0 | 200.9 | |
| 0 | 4 | 0 | 2 | -7.86 | 150.49 | 33.08 | 247.58 | 0.5871 | -675.0 | -484.1 | |
| 4 | 10 | 2 | 6 | -8.24 | 150.00 | 32.59 | 246.66 | 0.5828 | -230.6 | -259.1 | |
| 0 | 10 | 0 | 6 | -8.32 | 149.15 | 31.75 | 245.98 | 0.5722 | -386.0 | -273.5 | |
| 5 | 354 | 3 | 210 | -7.95 | 148.51 | 31.11 | 246.12 | 0.5617 | 745.8 | -607.1 | |
| 4 | -8 | 3 | -8 | -7.56 | 148.06 | 30.66 | 246.45 | 0.5535 | -793.7 | 999999 | |
| 11 | -8 | 6 | -8 | -8.13 | 148.02 | 30.61 | 245.47 | 0.5562 | -977.0 | 999999 | |
| 6 | -8 | 3 | -8 | -7.75 | 147.80 | 30.39 | 245.94 | 0.5511 | -1552.5 | 999999 | |
| 14 | -8 | 8 | -8 | -7.98 | 147.54 | 30.13 | 245.37 | 0.5490 | -1706.7 | 999999 | |
| 3 | 11 | 2 | 6 | -9.33 | 147.57 | 30.16 | 243.18 | 0.5577 | 221.1 | 19.5 | |
| 5 | -8 | 3 | -8 | -8.37 | 147.25 | 29.84 | 244.50 | 0.5476 | -973.2 | 999999 | |
| 9 | -8 | 5 | -8 | -7.55 | 147.14 | 29.73 | 245.79 | 0.5411 | -1482.8 | 999999 | |
| 5 | -8 | 3 | -8 | -8.09 | 147.18 | 29.77 | 244.93 | 0.5449 | -1525.9 | 999999 | |
| 5 | -8 | 3 | -8 | -7.48 | 146.44 | 29.04 | 245.40 | 0.5314 | -1186.4 | 999999 | |
| 0 | 2 | 0 | 1 | -6.98 | 146.27 | 28.87 | 246.13 | 0.5261 | 411.0 | 361.4 | |
| 0 | 4 | 0 | 2 | -8.95 | 145.69 | 28.29 | 242.29 | 0.5309 | -623.0 | -401.9 | |
| 4 | 7 | 2 | 4 | -10.24 | 145.40 | 28.00 | 239.88 | 0.5361 | 686.3 | 481.2 | |
| 2 | 8 | 1 | 5 | -8.79 | 144.95 | 27.55 | 241.93 | 0.5201 | -559.0 | -392.8 | |
| 0 | 5 | 0 | 3 | -10.06 | 144.97 | 27.57 | 239.81 | 0.5293 | 748.0 | 477.2 | |
| 0 | 3 | 0 | 2 | -6.36 | 144.34 | 26.93 | 245.72 | 0.4958 | 680.0 | 559.0 | |
| 0 | 17 | 0 | 10 | -8.51 | 144.30 | 26.90 | 241.83 | 0.5096 | 751.0 | 382.6 | |
| 5 | 257 | 3 | 145 | -7.71 | 143.75 | 26.35 | 242.75 | 0.4967 | -661.2 | 591.8 | |
| 0 | 3 | 0 | 2 | -9.04 | 143.54 | 26.13 | 240.18 | 0.5034 | 711.0 | 434.6 | |
| 0 | 3 | 0 | 2 | -9.69 | 143.46 | 26.05 | 238.98 | 0.5072 | 454.0 | 419.2 | |
| 15 | -25 | 9 | -25 | -6.99 | 143.17 | 25.77 | 243.54 | 0.4840 | 1405.9 | 999999 | |
| 9 | 19 | 5 | 11 | -10.09 | 143.22 | 25.82 | 238.07 | 0.5073 | 1087.9 | 657.6 | |
| 5 | -25 | 3 | -25 | -6.70 | 142.94 | 25.53 | 243.88 | 0.4787 | 1658.5 | 999999 | |
| 7 | -25 | 4 | -25 | -6.89 | 142.68 | 25.28 | 243.28 | 0.4765 | 2157.0 | 999999 | |
| 14 | -25 | 8 | -25 | -7.37 | 142.62 | 25.22 | 242.32 | 0.4791 | 1463.6 | 999999 | |
| 0 | 11 | 0 | 6 | -7.84 | 142.12 | 24.72 | 240.97 | 0.4757 | 963.0 | 809.5 | |
| 0 | 10 | 0 | 6 | -8.26 | 141.71 | 24.31 | 239.75 | 0.4735 | 724.0 | 732.3 | |
| 0 | 3 | 0 | 1 | -5.54 | 141.52 | 24.11 | 244.81 | 0.4512 | 735.0 | 587.7 | |
| 4 | 34 | 2 | 19 | -7.72 | 141.33 | 23.92 | 240.37 | 0.4642 | 1052.0 | 1011.7 | |
| 0 | 4 | 0 | 3 | -10.01 | 141.35 | 23.95 | 236.24 | 0.4828 | 911.0 | 702.9 | |
| 0 | 3 | 0 | 2 | -8.69 | 141.26 | 23.85 | 238.48 | 0.4708 | 834.0 | 685.7 | |
| 7 | -36 | 4 | -36 | -7.59 | 141.14 | 23.74 | 240.42 | 0.4607 | 1326.8 | 999999 | |
| Proj. U | - Projected umbra area in millionths of solar disc, negative values indicate | |
|
that the umbra consists of fragmented regions which cannot be separated without losing umbral area. In this way several spots (intensity minima in the umbra) have a common umbra, e.g. -2 means that the given spot shares an umbra with spot No.2, and the common U value is indicated at spot No.2. |
||
| Proj. WS | - Projected whole spot area in millionths of solar disc, negative values indicate | |
|
that several umbras have a common penumbra, e.g. -7 means that the given umbra shares a penumbra with umbra No.7, and the WS value is indicated at No.7. |
||
| Corr. U | - Corrected umbra area in millionths of solar hemisphere, for negative values see above | |
| Corr. WS | - Corrected whole spot area in millionths of solar hemisphere, for negative values see above | |
| B | - Heliographic latitude B; positive: North, negative: South | |
| L | - Heliographic longitude L | |
| LCM | - Longitudinal distance from the Sun's central meridian | |
| Pos. angle | - Position angle | |
| r | - Distance from the centre of Sun's disc in terms of Sun's radius | |
| MU | - Mean magnetic field within the umbra contour averaged the pixel values with sign. | |
| MP | - Mean magnetic field within the penumbra contour averaged the pixel values with sign. | |