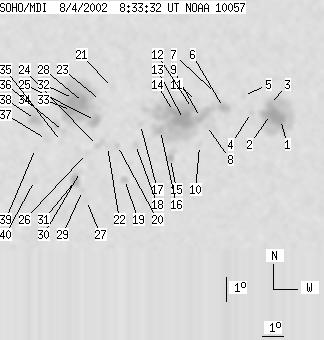
SOHO MDI 2002-08-04 08:33:32 UT
| group | Proj. U | Proj. WS | Corr. U | Corr. WS | B | L | LCM | Pos. angle | r | MU | MP |
| 191 | 940 | 115 | 560 | -7.84 | 146.94 | 30.73 | 245.82 | 0.5557 | -214.5 | -103.7 | |
|
previous
or next observation for the same group /
back to the solar disc SOHO MDI 2002-08-04 08:33:32 UT |
| spot | Proj. U | Proj. WS | Corr. U | Corr. WS | B | L | LCM | Pos. angle | r | MU | MP |
| 10 | 162 | 6 | 102 | -8.19 | 152.64 | 36.43 | 249.03 | 0.6318 | -1176.8 | -487.3 | |
| 25 | -1 | 16 | -1 | -7.95 | 152.12 | 35.91 | 249.10 | 0.6241 | -1429.2 | 999999 | |
| 4 | -1 | 3 | -1 | -7.54 | 152.03 | 35.82 | 249.68 | 0.6210 | -1036.5 | 999999 | |
| 0 | 4 | 0 | 3 | -7.81 | 151.18 | 34.97 | 248.78 | 0.6113 | -692.0 | -595.4 | |
| 0 | 5 | 0 | 3 | -7.09 | 150.72 | 34.51 | 249.64 | 0.6019 | 348.0 | 208.9 | |
| 8 | 336 | 5 | 203 | -7.52 | 149.79 | 33.58 | 248.42 | 0.5920 | -1060.0 | -605.9 | |
| 0 | 5 | 0 | 3 | -6.93 | 149.36 | 33.15 | 249.10 | 0.5833 | -8.0 | 22.3 | |
| 0 | 14 | 0 | 8 | -8.21 | 149.04 | 32.83 | 246.86 | 0.5858 | 677.0 | -72.5 | |
| 9 | -6 | 5 | -6 | -7.87 | 148.73 | 32.52 | 247.20 | 0.5798 | 257.7 | 999999 | |
| 0 | 4 | 0 | 2 | -9.01 | 148.79 | 32.58 | 245.43 | 0.5870 | -630.0 | -456.7 | |
| 0 | 8 | 0 | 5 | -7.16 | 148.48 | 32.27 | 248.18 | 0.5728 | -845.0 | -564.5 | |
| 5 | -6 | 3 | -6 | -7.48 | 148.32 | 32.11 | 247.56 | 0.5723 | -879.1 | 999999 | |
| 31 | -6 | 19 | -6 | -7.90 | 147.93 | 31.72 | 246.61 | 0.5695 | -1400.5 | 999999 | |
| 8 | -6 | 5 | -6 | -7.55 | 147.43 | 31.22 | 246.85 | 0.5610 | -1664.9 | 999999 | |
| 4 | 16 | 2 | 9 | -9.47 | 147.47 | 31.25 | 243.77 | 0.5727 | 284.0 | -99.7 | |
| 6 | -6 | 4 | -6 | -8.29 | 146.89 | 30.68 | 245.25 | 0.5581 | -1101.2 | 999999 | |
| 0 | 4 | 0 | 3 | -8.00 | 145.94 | 29.73 | 245.03 | 0.5438 | -603.0 | -548.9 | |
| 0 | 5 | 0 | 3 | -8.80 | 145.77 | 29.56 | 243.56 | 0.5466 | -630.0 | -367.9 | |
| 3 | 9 | 2 | 5 | -10.22 | 145.40 | 29.19 | 240.95 | 0.5512 | 720.3 | 476.1 | |
| 0 | 5 | 0 | 3 | -8.80 | 144.95 | 28.74 | 242.90 | 0.5358 | -441.0 | -299.9 | |
| 0 | 7 | 0 | 4 | -6.42 | 144.55 | 28.34 | 246.71 | 0.5156 | 718.0 | 539.1 | |
| 0 | 4 | 0 | 2 | -8.82 | 144.49 | 28.28 | 242.49 | 0.5300 | -378.0 | -389.7 | |
| 0 | 7 | 0 | 4 | -6.92 | 144.04 | 27.83 | 245.41 | 0.5116 | 499.0 | 174.6 | |
| 0 | 10 | 0 | 6 | -8.75 | 144.03 | 27.82 | 242.21 | 0.5235 | 817.0 | 506.0 | |
| 11 | 240 | 7 | 137 | -7.73 | 143.86 | 27.65 | 243.85 | 0.5144 | -712.3 | 577.7 | |
| 0 | 4 | 0 | 2 | -9.06 | 143.56 | 27.35 | 241.28 | 0.5194 | 640.0 | 601.8 | |
| 0 | 5 | 0 | 3 | -11.00 | 143.74 | 27.53 | 238.22 | 0.5358 | 656.0 | 497.2 | |
| 15 | -25 | 8 | -25 | -6.97 | 143.27 | 27.06 | 244.71 | 0.5015 | 1345.8 | 999999 | |
| 0 | 3 | 0 | 2 | -10.57 | 143.52 | 27.31 | 238.70 | 0.5299 | 666.0 | 502.4 | |
| 0 | 4 | 0 | 2 | -9.78 | 143.35 | 27.14 | 239.86 | 0.5219 | 425.0 | 435.5 | |
| 10 | 21 | 6 | 12 | -10.14 | 143.16 | 26.95 | 239.07 | 0.5221 | 1012.4 | 526.6 | |
| 16 | -25 | 9 | -25 | -6.78 | 142.82 | 26.61 | 244.65 | 0.4941 | 1913.1 | 999999 | |
| 15 | -25 | 9 | -25 | -7.27 | 142.76 | 26.55 | 243.72 | 0.4964 | 1510.8 | 999999 | |
| 0 | 4 | 0 | 2 | -8.11 | 142.46 | 26.25 | 241.93 | 0.4982 | 386.0 | 311.4 | |
| 0 | 4 | 0 | 3 | -8.51 | 142.40 | 26.19 | 241.16 | 0.5002 | 353.0 | 261.2 | |
| 3 | 10 | 1 | 6 | -7.85 | 142.13 | 25.92 | 242.10 | 0.4919 | 986.6 | 788.6 | |
| 0 | 5 | 0 | 3 | -8.40 | 141.72 | 25.51 | 240.72 | 0.4905 | 988.0 | 743.9 | |
| 8 | 27 | 5 | 15 | -7.56 | 141.18 | 24.97 | 241.72 | 0.4771 | 1387.0 | 1057.4 | |
| 0 | 3 | 0 | 2 | -8.74 | 141.26 | 25.05 | 239.64 | 0.4870 | 267.0 | 460.9 | |
| 0 | 5 | 0 | 3 | -10.06 | 141.32 | 25.11 | 237.39 | 0.4980 | 835.0 | 634.4 | |
| Proj. U | - Projected umbra area in millionths of solar disc, negative values indicate | |
|
that the umbra consists of fragmented regions which cannot be separated without losing umbral area. In this way several spots (intensity minima in the umbra) have a common umbra, e.g. -2 means that the given spot shares an umbra with spot No.2, and the common U value is indicated at spot No.2. |
||
| Proj. WS | - Projected whole spot area in millionths of solar disc, negative values indicate | |
|
that several umbras have a common penumbra, e.g. -7 means that the given umbra shares a penumbra with umbra No.7, and the WS value is indicated at No.7. |
||
| Corr. U | - Corrected umbra area in millionths of solar hemisphere, for negative values see above | |
| Corr. WS | - Corrected whole spot area in millionths of solar hemisphere, for negative values see above | |
| B | - Heliographic latitude B; positive: North, negative: South | |
| L | - Heliographic longitude L | |
| LCM | - Longitudinal distance from the Sun's central meridian | |
| Pos. angle | - Position angle | |
| r | - Distance from the centre of Sun's disc in terms of Sun's radius | |
| MU | - Mean magnetic field within the umbra contour averaged the pixel values with sign. | |
| MP | - Mean magnetic field within the penumbra contour averaged the pixel values with sign. | |