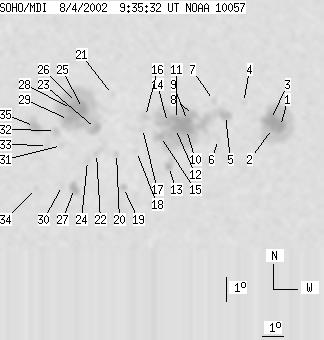
SOHO MDI 2002-08-04 09:35:32 UT
| group | Proj. U | Proj. WS | Corr. U | Corr. WS | B | L | LCM | Pos. angle | r | MU | MP |
| 166 | 882 | 102 | 526 | -7.78 | 146.98 | 31.34 | 246.35 | 0.5633 | -353.8 | -63.2 | |
|
previous
or next observation for the same group /
back to the solar disc SOHO MDI 2002-08-04 09:35:32 UT |
| spot | Proj. U | Proj. WS | Corr. U | Corr. WS | B | L | LCM | Pos. angle | r | MU | MP |
| 11 | 165 | 7 | 105 | -8.19 | 152.72 | 37.08 | 249.38 | 0.6400 | -1034.7 | -450.5 | |
| 3 | -1 | 2 | -1 | -8.24 | 152.33 | 36.69 | 249.09 | 0.6353 | -1395.2 | 999999 | |
| 23 | -1 | 15 | -1 | -7.87 | 152.19 | 36.55 | 249.57 | 0.6318 | -1487.7 | 999999 | |
| 0 | 4 | 0 | 2 | -7.09 | 150.78 | 35.14 | 249.99 | 0.6101 | 129.0 | 267.9 | |
| 8 | 314 | 5 | 190 | -7.57 | 149.95 | 34.31 | 248.78 | 0.6016 | -1014.7 | -546.1 | |
| 0 | 7 | 0 | 4 | -8.53 | 149.71 | 34.07 | 247.14 | 0.6034 | -516.0 | -452.4 | |
| 0 | 5 | 0 | 3 | -6.92 | 149.32 | 33.68 | 249.43 | 0.5902 | 58.0 | 31.0 | |
| 4 | -5 | 3 | -5 | -7.43 | 148.41 | 32.76 | 248.05 | 0.5808 | -766.6 | 999999 | |
| 7 | -5 | 4 | -5 | -7.66 | 148.14 | 32.50 | 247.52 | 0.5785 | -1466.0 | 999999 | |
| 17 | -5 | 10 | -5 | -8.03 | 148.13 | 32.48 | 246.92 | 0.5803 | -1152.6 | 999999 | |
| 10 | -5 | 6 | -5 | -7.59 | 147.61 | 31.97 | 247.29 | 0.5712 | -1740.7 | 999999 | |
| 5 | -5 | 3 | -5 | -7.96 | 147.60 | 31.96 | 246.69 | 0.5730 | -1566.7 | 999999 | |
| 5 | 16 | 3 | 9 | -9.50 | 147.42 | 31.78 | 244.11 | 0.5795 | 357.5 | -140.5 | |
| 4 | -5 | 3 | -5 | -7.69 | 147.20 | 31.56 | 246.85 | 0.5662 | -1646.9 | 999999 | |
| 4 | -5 | 3 | -5 | -8.24 | 146.92 | 31.28 | 245.75 | 0.5657 | -1160.5 | 999999 | |
| 0 | 8 | 0 | 5 | -7.39 | 146.15 | 30.51 | 246.63 | 0.5506 | -942.0 | -481.8 | |
| 0 | 7 | 0 | 4 | -7.87 | 146.05 | 30.41 | 245.75 | 0.5521 | -525.0 | -533.1 | |
| 0 | 4 | 0 | 2 | -8.80 | 145.85 | 30.21 | 244.07 | 0.5550 | -647.0 | -465.3 | |
| 3 | 6 | 2 | 4 | -10.25 | 145.39 | 29.75 | 241.36 | 0.5585 | 634.2 | 490.3 | |
| 0 | 3 | 0 | 2 | -8.83 | 144.93 | 29.29 | 243.30 | 0.5432 | -422.0 | -322.9 | |
| 0 | 4 | 0 | 2 | -6.41 | 144.57 | 28.92 | 247.16 | 0.5236 | 666.0 | 576.7 | |
| 0 | 10 | 0 | 6 | -8.78 | 144.01 | 28.37 | 242.63 | 0.5309 | 679.0 | 533.6 | |
| 8 | 252 | 5 | 145 | -7.76 | 143.88 | 28.24 | 244.28 | 0.5225 | -846.7 | 603.0 | |
| 0 | 6 | 0 | 4 | -9.05 | 143.62 | 27.98 | 241.85 | 0.5276 | 410.0 | 550.1 | |
| 16 | -23 | 9 | -23 | -6.91 | 143.24 | 27.60 | 245.25 | 0.5085 | 1366.2 | 999999 | |
| 4 | -23 | 2 | -23 | -6.65 | 142.95 | 27.31 | 245.48 | 0.5030 | 1594.5 | 999999 | |
| 9 | 18 | 5 | 11 | -10.17 | 143.14 | 27.49 | 239.54 | 0.5293 | 948.8 | 579.4 | |
| 8 | -23 | 5 | -23 | -6.89 | 142.74 | 27.10 | 244.88 | 0.5016 | 2087.7 | 999999 | |
| 8 | -23 | 5 | -23 | -7.33 | 142.64 | 27.00 | 244.00 | 0.5030 | 1493.9 | 999999 | |
| 0 | 4 | 0 | 2 | -10.02 | 142.58 | 26.94 | 239.27 | 0.5211 | 699.0 | 533.9 | |
| 0 | 4 | 0 | 2 | -8.37 | 142.40 | 26.76 | 241.92 | 0.5068 | 463.0 | 406.5 | |
| 0 | 9 | 0 | 5 | -7.75 | 142.09 | 26.44 | 242.75 | 0.4983 | 927.0 | 866.7 | |
| 0 | 6 | 0 | 3 | -8.34 | 141.77 | 26.13 | 241.40 | 0.4983 | 830.0 | 763.3 | |
| 0 | 4 | 0 | 2 | -10.08 | 141.37 | 25.73 | 237.98 | 0.5062 | 815.0 | 659.4 | |
| 9 | 26 | 5 | 14 | -7.54 | 141.14 | 25.50 | 242.26 | 0.4841 | 1352.5 | 1016.0 | |
| Proj. U | - Projected umbra area in millionths of solar disc, negative values indicate | |
|
that the umbra consists of fragmented regions which cannot be separated without losing umbral area. In this way several spots (intensity minima in the umbra) have a common umbra, e.g. -2 means that the given spot shares an umbra with spot No.2, and the common U value is indicated at spot No.2. |
||
| Proj. WS | - Projected whole spot area in millionths of solar disc, negative values indicate | |
|
that several umbras have a common penumbra, e.g. -7 means that the given umbra shares a penumbra with umbra No.7, and the WS value is indicated at No.7. |
||
| Corr. U | - Corrected umbra area in millionths of solar hemisphere, for negative values see above | |
| Corr. WS | - Corrected whole spot area in millionths of solar hemisphere, for negative values see above | |
| B | - Heliographic latitude B; positive: North, negative: South | |
| L | - Heliographic longitude L | |
| LCM | - Longitudinal distance from the Sun's central meridian | |
| Pos. angle | - Position angle | |
| r | - Distance from the centre of Sun's disc in terms of Sun's radius | |
| MU | - Mean magnetic field within the umbra contour averaged the pixel values with sign. | |
| MP | - Mean magnetic field within the penumbra contour averaged the pixel values with sign. | |