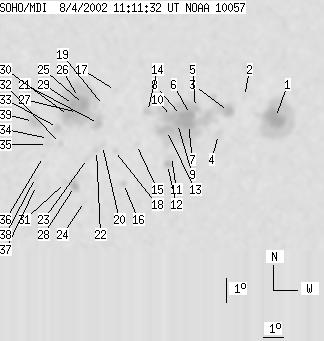
SOHO MDI 2002-08-04 11:11:32 UT
| group | Proj. U | Proj. WS | Corr. U | Corr. WS | B | L | LCM | Pos. angle | r | MU | MP |
| 163 | 954 | 101 | 578 | -7.80 | 147.05 | 32.30 | 246.96 | 0.5759 | -374.3 | -67.5 | |
|
previous
or next observation for the same group /
back to the solar disc SOHO MDI 2002-08-04 11:11:32 UT |
| spot | Proj. U | Proj. WS | Corr. U | Corr. WS | B | L | LCM | Pos. angle | r | MU | MP |
| 33 | 179 | 22 | 116 | -7.98 | 152.52 | 37.76 | 250.03 | 0.6475 | -1351.8 | -419.4 | |
| 0 | 2 | 0 | 2 | -7.02 | 150.87 | 36.11 | 250.61 | 0.6224 | 256.0 | 189.0 | |
| 11 | 351 | 7 | 215 | -7.59 | 150.13 | 35.38 | 249.35 | 0.6155 | -938.2 | -493.5 | |
| 0 | 12 | 0 | 8 | -8.50 | 149.74 | 34.98 | 247.74 | 0.6149 | -741.0 | -515.9 | |
| 4 | -3 | 3 | -3 | -7.32 | 148.51 | 33.75 | 248.83 | 0.5932 | -813.6 | 999999 | |
| 7 | -3 | 4 | -3 | -7.60 | 148.29 | 33.53 | 248.27 | 0.5917 | -1384.3 | 999999 | |
| 15 | -3 | 9 | -3 | -8.00 | 148.23 | 33.48 | 247.60 | 0.5930 | -1066.7 | 999999 | |
| 6 | -3 | 4 | -3 | -7.61 | 147.86 | 33.11 | 247.98 | 0.5862 | -1644.5 | 999999 | |
| 7 | -3 | 4 | -3 | -7.93 | 147.70 | 32.94 | 247.37 | 0.5857 | -1440.0 | 999999 | |
| 8 | -3 | 5 | -3 | -7.62 | 147.39 | 32.63 | 247.66 | 0.5800 | -1700.4 | 999999 | |
| 0 | 7 | 0 | 4 | -9.26 | 147.55 | 32.79 | 245.17 | 0.5911 | -287.0 | -248.7 | |
| 4 | 12 | 3 | 7 | -9.58 | 147.39 | 32.63 | 244.57 | 0.5910 | 497.3 | 135.5 | |
| 11 | -3 | 7 | -3 | -8.18 | 147.20 | 32.44 | 246.64 | 0.5806 | -1179.0 | 999999 | |
| 2 | 11 | 1 | 6 | -7.35 | 146.24 | 31.48 | 247.34 | 0.5633 | -520.9 | -379.9 | |
| 0 | 4 | 0 | 2 | -8.67 | 145.83 | 31.08 | 244.91 | 0.5656 | -470.0 | -396.3 | |
| 0 | 6 | 0 | 3 | -10.25 | 145.38 | 30.63 | 242.06 | 0.5696 | 693.0 | 551.8 | |
| 0 | 3 | 0 | 2 | -6.42 | 144.68 | 29.92 | 247.86 | 0.5373 | 700.0 | 589.4 | |
| 0 | 4 | 0 | 2 | -8.86 | 144.83 | 30.07 | 243.85 | 0.5537 | -562.0 | -355.0 | |
| 0 | 2 | 0 | 1 | -7.00 | 144.17 | 29.41 | 246.49 | 0.5336 | 550.0 | 447.4 | |
| 0 | 5 | 0 | 3 | -8.63 | 144.25 | 29.49 | 243.79 | 0.5447 | 712.0 | 536.5 | |
| 4 | 255 | 2 | 148 | -7.72 | 144.00 | 29.24 | 245.12 | 0.5356 | -915.4 | 510.8 | |
| 0 | 5 | 0 | 3 | -8.82 | 143.99 | 29.24 | 243.27 | 0.5425 | 599.0 | 461.2 | |
| 0 | 5 | 0 | 3 | -9.13 | 143.61 | 28.85 | 242.44 | 0.5395 | 645.0 | 611.4 | |
| 0 | 3 | 0 | 2 | -10.89 | 143.64 | 28.89 | 239.60 | 0.5521 | 597.0 | 467.2 | |
| 13 | -21 | 7 | -21 | -6.91 | 143.25 | 28.50 | 245.95 | 0.5207 | 1318.9 | 999999 | |
| 4 | -21 | 3 | -21 | -6.61 | 143.01 | 28.25 | 246.29 | 0.5156 | 1577.0 | 999999 | |
| 4 | -21 | 2 | -21 | -7.22 | 143.00 | 28.24 | 245.21 | 0.5192 | 1220.1 | 999999 | |
| 5 | 17 | 3 | 10 | -10.25 | 143.12 | 28.36 | 240.18 | 0.5409 | 1000.8 | 662.0 | |
| 8 | -21 | 5 | -21 | -6.89 | 142.80 | 28.04 | 245.64 | 0.5144 | 2005.7 | 999999 | |
| 9 | -21 | 5 | -21 | -7.32 | 142.60 | 27.84 | 244.71 | 0.5144 | 1462.0 | 999999 | |
| 0 | 5 | 0 | 3 | -10.06 | 142.69 | 27.93 | 240.10 | 0.5341 | 723.0 | 684.3 | |
| 0 | 5 | 0 | 3 | -8.45 | 142.32 | 27.57 | 242.50 | 0.5181 | 625.0 | 443.6 | |
| 3 | 9 | 2 | 5 | -7.79 | 142.14 | 27.38 | 243.50 | 0.5112 | 1020.5 | 732.0 | |
| 0 | 7 | 0 | 4 | -8.22 | 141.77 | 27.01 | 242.42 | 0.5091 | 864.0 | 673.8 | |
| 0 | 9 | 0 | 5 | -8.46 | 141.74 | 26.98 | 241.97 | 0.5104 | 837.0 | 675.3 | |
| 0 | 3 | 0 | 2 | -8.94 | 141.60 | 26.84 | 241.00 | 0.5120 | 782.0 | 618.4 | |
| 0 | 3 | 0 | 2 | -10.12 | 141.38 | 26.63 | 238.80 | 0.5178 | 726.0 | 629.0 | |
| 0 | 5 | 0 | 3 | -9.79 | 141.31 | 26.55 | 239.28 | 0.5144 | 731.0 | 671.9 | |
| 5 | 25 | 3 | 14 | -7.49 | 141.04 | 26.29 | 243.07 | 0.4945 | 1411.2 | 1031.3 | |
| Proj. U | - Projected umbra area in millionths of solar disc, negative values indicate | |
|
that the umbra consists of fragmented regions which cannot be separated without losing umbral area. In this way several spots (intensity minima in the umbra) have a common umbra, e.g. -2 means that the given spot shares an umbra with spot No.2, and the common U value is indicated at spot No.2. |
||
| Proj. WS | - Projected whole spot area in millionths of solar disc, negative values indicate | |
|
that several umbras have a common penumbra, e.g. -7 means that the given umbra shares a penumbra with umbra No.7, and the WS value is indicated at No.7. |
||
| Corr. U | - Corrected umbra area in millionths of solar hemisphere, for negative values see above | |
| Corr. WS | - Corrected whole spot area in millionths of solar hemisphere, for negative values see above | |
| B | - Heliographic latitude B; positive: North, negative: South | |
| L | - Heliographic longitude L | |
| LCM | - Longitudinal distance from the Sun's central meridian | |
| Pos. angle | - Position angle | |
| r | - Distance from the centre of Sun's disc in terms of Sun's radius | |
| MU | - Mean magnetic field within the umbra contour averaged the pixel values with sign. | |
| MP | - Mean magnetic field within the penumbra contour averaged the pixel values with sign. | |