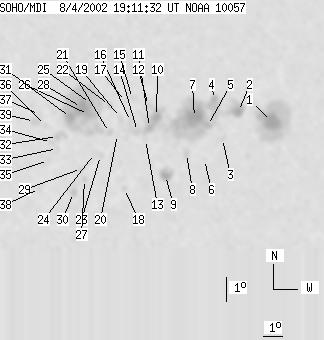
SOHO MDI 2002-08-04 19:11:32 UT
| group | Proj. U | Proj. WS | Corr. U | Corr. WS | B | L | LCM | Pos. angle | r | MU | MP |
| 147 | 922 | 96 | 593 | -7.70 | 147.43 | 37.08 | 249.92 | 0.6368 | -181.0 | -130.7 | |
|
previous
or next observation for the same group /
back to the solar disc SOHO MDI 2002-08-04 19:11:32 UT |
| spot | Proj. U | Proj. WS | Corr. U | Corr. WS | B | L | LCM | Pos. angle | r | MU | MP |
| 27 | 180 | 19 | 125 | -8.05 | 152.83 | 42.48 | 252.07 | 0.7051 | -1243.0 | -435.5 | |
| 10 | 36 | 7 | 24 | -7.51 | 151.00 | 40.65 | 252.04 | 0.6812 | -970.0 | -495.8 | |
| 0 | 6 | 0 | 4 | -8.56 | 150.28 | 39.93 | 250.24 | 0.6768 | -740.0 | -621.6 | |
| 5 | 234 | 3 | 153 | -6.94 | 149.68 | 39.33 | 252.28 | 0.6628 | 343.0 | -606.7 | |
| 4 | -4 | 3 | -4 | -7.97 | 149.43 | 39.08 | 250.67 | 0.6640 | 398.6 | 999999 | |
| 0 | 2 | 0 | 1 | -9.36 | 149.45 | 39.10 | 248.71 | 0.6702 | -595.0 | -548.6 | |
| 30 | -4 | 19 | -4 | -7.60 | 148.72 | 38.38 | 250.87 | 0.6536 | -1439.5 | 999999 | |
| 0 | 7 | 0 | 5 | -9.05 | 148.48 | 38.14 | 248.65 | 0.6571 | -567.0 | -474.8 | |
| 9 | 26 | 6 | 17 | -9.89 | 147.53 | 37.18 | 246.93 | 0.6494 | 826.8 | 291.3 | |
| 9 | 45 | 6 | 29 | -7.43 | 146.79 | 36.45 | 250.14 | 0.6286 | -1090.1 | -604.9 | |
| 6 | -10 | 4 | -10 | -7.86 | 146.49 | 36.14 | 249.33 | 0.6267 | -784.4 | 999999 | |
| 0 | 6 | 0 | 4 | -6.96 | 146.35 | 36.01 | 250.63 | 0.6208 | -421.0 | -446.5 | |
| 0 | 2 | 0 | 1 | -8.34 | 146.34 | 35.99 | 248.53 | 0.6271 | -464.0 | -439.5 | |
| 0 | 5 | 0 | 3 | -7.99 | 145.91 | 35.56 | 248.82 | 0.6199 | -244.0 | -169.5 | |
| 0 | 8 | 0 | 5 | -6.62 | 145.54 | 35.19 | 250.71 | 0.6087 | 440.0 | 298.9 | |
| 0 | 9 | 0 | 6 | -7.56 | 145.52 | 35.18 | 249.26 | 0.6129 | -258.0 | -272.9 | |
| 0 | 2 | 0 | 1 | -6.73 | 145.21 | 34.86 | 250.37 | 0.6049 | 485.0 | 341.9 | |
| 0 | 4 | 0 | 3 | -10.29 | 145.54 | 35.19 | 245.16 | 0.6271 | 388.0 | 347.5 | |
| 0 | 8 | 0 | 5 | -7.36 | 145.02 | 34.67 | 249.28 | 0.6054 | -129.0 | -166.4 | |
| 0 | 3 | 0 | 2 | -8.05 | 144.94 | 34.59 | 248.17 | 0.6078 | 355.0 | 150.0 | |
| 0 | 6 | 0 | 4 | -7.94 | 144.54 | 34.19 | 248.09 | 0.6021 | 525.0 | 387.9 | |
| 0 | 6 | 0 | 3 | -6.84 | 144.44 | 34.09 | 249.76 | 0.5954 | 669.0 | 593.2 | |
| 0 | 4 | 0 | 2 | -8.86 | 144.20 | 33.85 | 246.47 | 0.6025 | 810.0 | 646.3 | |
| 0 | 2 | 0 | 1 | -8.76 | 143.90 | 33.55 | 246.43 | 0.5981 | 125.0 | 213.3 | |
| 3 | 252 | 2 | 153 | -6.70 | 143.52 | 33.17 | 249.44 | 0.5826 | 943.0 | 443.7 | |
| 5 | -25 | 3 | -25 | -7.15 | 143.46 | 33.11 | 248.70 | 0.5840 | 965.9 | 999999 | |
| 0 | 5 | 0 | 3 | -9.80 | 143.53 | 33.18 | 244.58 | 0.5993 | 526.0 | 411.2 | |
| 21 | -25 | 13 | -25 | -6.84 | 143.10 | 32.75 | 248.97 | 0.5777 | 1657.6 | 999999 | |
| 0 | 3 | 0 | 2 | -9.34 | 143.33 | 32.99 | 245.16 | 0.5942 | 768.0 | 630.8 | |
| 3 | 9 | 2 | 6 | -10.31 | 143.06 | 32.71 | 243.49 | 0.5964 | 650.0 | 565.3 | |
| 15 | -25 | 9 | -25 | -7.22 | 142.61 | 32.26 | 248.05 | 0.5732 | 1397.8 | 999999 | |
| 0 | 11 | 0 | 7 | -7.96 | 142.06 | 31.71 | 246.48 | 0.5699 | 1197.0 | 797.1 | |
| 0 | 5 | 0 | 3 | -8.45 | 142.11 | 31.76 | 245.72 | 0.5733 | 710.0 | 584.8 | |
| 0 | 3 | 0 | 2 | -8.19 | 141.80 | 31.45 | 245.93 | 0.5678 | 932.0 | 790.2 | |
| 0 | 10 | 0 | 6 | -8.92 | 141.73 | 31.38 | 244.70 | 0.5711 | 855.0 | 695.2 | |
| 0 | 3 | 0 | 2 | -7.48 | 141.46 | 31.11 | 246.86 | 0.5593 | 492.0 | 592.3 | |
| 0 | 4 | 0 | 2 | -7.01 | 141.14 | 30.80 | 247.42 | 0.5525 | 892.0 | 683.3 | |
| 0 | 7 | 0 | 4 | -10.05 | 141.42 | 31.07 | 242.69 | 0.5741 | 665.0 | 588.5 | |
| 0 | 9 | 0 | 5 | -7.29 | 140.93 | 30.58 | 246.81 | 0.5512 | 1169.0 | 1019.3 | |
| Proj. U | - Projected umbra area in millionths of solar disc, negative values indicate | |
|
that the umbra consists of fragmented regions which cannot be separated without losing umbral area. In this way several spots (intensity minima in the umbra) have a common umbra, e.g. -2 means that the given spot shares an umbra with spot No.2, and the common U value is indicated at spot No.2. |
||
| Proj. WS | - Projected whole spot area in millionths of solar disc, negative values indicate | |
|
that several umbras have a common penumbra, e.g. -7 means that the given umbra shares a penumbra with umbra No.7, and the WS value is indicated at No.7. |
||
| Corr. U | - Corrected umbra area in millionths of solar hemisphere, for negative values see above | |
| Corr. WS | - Corrected whole spot area in millionths of solar hemisphere, for negative values see above | |
| B | - Heliographic latitude B; positive: North, negative: South | |
| L | - Heliographic longitude L | |
| LCM | - Longitudinal distance from the Sun's central meridian | |
| Pos. angle | - Position angle | |
| r | - Distance from the centre of Sun's disc in terms of Sun's radius | |
| MU | - Mean magnetic field within the umbra contour averaged the pixel values with sign. | |
| MP | - Mean magnetic field within the penumbra contour averaged the pixel values with sign. | |