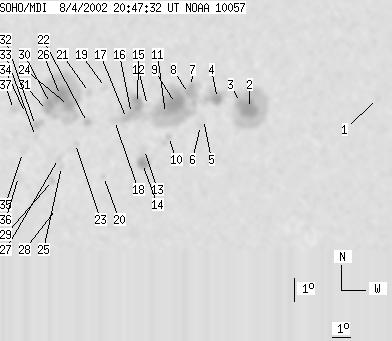
SOHO MDI 2002-08-04 20:47:32 UT
| group | Proj. U | Proj. WS | Corr. U | Corr. WS | B | L | LCM | Pos. angle | r | MU | MP |
| 172 | 946 | 112 | 619 | -7.70 | 147.68 | 38.22 | 250.49 | 0.6511 | -384.3 | -118.3 | |
|
previous
or next observation for the same group /
back to the solar disc SOHO MDI 2002-08-04 20:47:32 UT |
| spot | Proj. U | Proj. WS | Corr. U | Corr. WS | B | L | LCM | Pos. angle | r | MU | MP |
| 0 | 4 | 0 | 3 | -8.24 | 160.54 | 51.07 | 254.87 | 0.7998 | -83.0 | -32.0 | |
| 27 | 182 | 19 | 129 | -8.04 | 152.93 | 43.47 | 252.49 | 0.7166 | -1171.1 | -427.8 | |
| 8 | -2 | 5 | -2 | -7.76 | 152.40 | 42.93 | 252.66 | 0.7094 | -1158.8 | 999999 | |
| 10 | 47 | 7 | 32 | -7.50 | 151.12 | 41.66 | 252.48 | 0.6934 | -967.2 | -462.4 | |
| 0 | 3 | 0 | 2 | -8.31 | 150.48 | 41.01 | 251.09 | 0.6887 | -782.0 | -698.3 | |
| 0 | 4 | 0 | 3 | -8.54 | 150.35 | 40.88 | 250.70 | 0.6881 | -722.0 | -554.2 | |
| 4 | 231 | 2 | 153 | -6.91 | 149.68 | 40.22 | 252.70 | 0.6737 | 227.2 | -526.4 | |
| 4 | -7 | 3 | -7 | -7.19 | 149.56 | 40.09 | 252.25 | 0.6732 | -860.5 | 999999 | |
| 35 | -7 | 23 | -7 | -7.55 | 148.92 | 39.45 | 251.45 | 0.6668 | -1393.1 | 999999 | |
| 0 | 10 | 0 | 7 | -8.88 | 148.71 | 39.25 | 249.46 | 0.6698 | -555.0 | -422.2 | |
| 4 | -7 | 3 | -7 | -7.92 | 148.44 | 38.98 | 250.69 | 0.6625 | -1080.2 | 999999 | |
| 0 | 3 | 0 | 2 | -7.53 | 147.48 | 38.01 | 250.78 | 0.6488 | -678.0 | -769.0 | |
| 0 | 7 | 0 | 5 | -9.33 | 147.54 | 38.07 | 248.22 | 0.6576 | -462.0 | -360.4 | |
| 11 | 24 | 7 | 15 | -9.90 | 147.51 | 38.05 | 247.39 | 0.6600 | 737.6 | 356.5 | |
| 15 | 79 | 10 | 51 | -7.42 | 146.96 | 37.50 | 250.70 | 0.6419 | -1163.5 | -719.6 | |
| 4 | -15 | 2 | -15 | -7.81 | 146.70 | 37.23 | 249.99 | 0.6403 | -940.3 | 999999 | |
| 3 | -15 | 2 | -15 | -7.99 | 146.47 | 37.00 | 249.59 | 0.6382 | -783.1 | 999999 | |
| 0 | 10 | 0 | 6 | -8.04 | 145.88 | 36.41 | 249.21 | 0.6309 | -162.0 | -132.4 | |
| 0 | 8 | 0 | 5 | -6.66 | 145.30 | 35.83 | 250.99 | 0.6173 | 218.0 | 387.1 | |
| 0 | 3 | 0 | 2 | -10.31 | 145.60 | 36.13 | 245.71 | 0.6388 | 484.0 | 403.2 | |
| 0 | 6 | 0 | 4 | -6.81 | 144.53 | 35.06 | 250.34 | 0.6080 | 876.0 | 590.6 | |
| 4 | 11 | 2 | 7 | -8.03 | 144.54 | 35.08 | 248.47 | 0.6140 | 728.5 | 363.6 | |
| 0 | 4 | 0 | 2 | -8.86 | 144.04 | 34.58 | 246.92 | 0.6118 | 600.0 | 607.2 | |
| 11 | 242 | 7 | 148 | -7.28 | 143.55 | 34.08 | 249.06 | 0.5974 | 658.5 | 544.8 | |
| 0 | 3 | 0 | 2 | -9.76 | 143.47 | 34.00 | 245.18 | 0.6094 | 520.0 | 543.4 | |
| 21 | -24 | 13 | -24 | -6.85 | 143.13 | 33.66 | 249.49 | 0.5898 | 1635.8 | 999999 | |
| 0 | 5 | 0 | 3 | -9.42 | 143.28 | 33.82 | 245.57 | 0.6052 | 792.0 | 659.3 | |
| 0 | 3 | 0 | 2 | -11.49 | 143.44 | 33.98 | 242.60 | 0.6191 | 488.0 | 416.7 | |
| 0 | 8 | 0 | 5 | -10.32 | 143.10 | 33.63 | 244.10 | 0.6079 | 698.0 | 650.1 | |
| 5 | -24 | 3 | -24 | -7.15 | 142.68 | 33.21 | 248.75 | 0.5853 | 1704.2 | 999999 | |
| 3 | -24 | 2 | -24 | -7.42 | 142.56 | 33.09 | 248.23 | 0.5851 | 1068.4 | 999999 | |
| 3 | 14 | 2 | 9 | -8.00 | 142.04 | 32.57 | 246.98 | 0.5814 | 981.3 | 729.8 | |
| 0 | 4 | 0 | 3 | -8.45 | 142.08 | 32.61 | 246.29 | 0.5844 | 592.0 | 485.8 | |
| 0 | 3 | 0 | 2 | -7.49 | 141.52 | 32.05 | 247.47 | 0.5718 | 770.0 | 617.5 | |
| 0 | 3 | 0 | 2 | -9.08 | 141.52 | 32.06 | 244.93 | 0.5808 | 866.0 | 779.3 | |
| 0 | 9 | 0 | 5 | -10.05 | 141.44 | 31.97 | 243.34 | 0.5856 | 588.0 | 564.9 | |
| 0 | 16 | 0 | 10 | -7.29 | 140.94 | 31.47 | 247.41 | 0.5631 | 1034.0 | 862.4 | |
| Proj. U | - Projected umbra area in millionths of solar disc, negative values indicate | |
|
that the umbra consists of fragmented regions which cannot be separated without losing umbral area. In this way several spots (intensity minima in the umbra) have a common umbra, e.g. -2 means that the given spot shares an umbra with spot No.2, and the common U value is indicated at spot No.2. |
||
| Proj. WS | - Projected whole spot area in millionths of solar disc, negative values indicate | |
|
that several umbras have a common penumbra, e.g. -7 means that the given umbra shares a penumbra with umbra No.7, and the WS value is indicated at No.7. |
||
| Corr. U | - Corrected umbra area in millionths of solar hemisphere, for negative values see above | |
| Corr. WS | - Corrected whole spot area in millionths of solar hemisphere, for negative values see above | |
| B | - Heliographic latitude B; positive: North, negative: South | |
| L | - Heliographic longitude L | |
| LCM | - Longitudinal distance from the Sun's central meridian | |
| Pos. angle | - Position angle | |
| r | - Distance from the centre of Sun's disc in terms of Sun's radius | |
| MU | - Mean magnetic field within the umbra contour averaged the pixel values with sign. | |
| MP | - Mean magnetic field within the penumbra contour averaged the pixel values with sign. | |