SOHO MDI 2002-08-04 22:23:32 UT
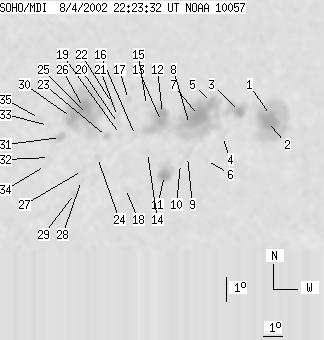
| group | Proj. U | Proj. WS | Corr. U | Corr. WS | B | L | LCM | Pos. angle | r | MU | MP |
| 165 | 1033 | 110 | 685 | -7.69 | 147.79 | 39.21 | 251.01 | 0.6633 | -363.1 | -148.3 | |
|
previous
or next observation for the same group /
back to the solar disc SOHO MDI 2002-08-04 22:23:32 UT |
| spot | Proj. U | Proj. WS | Corr. U | Corr. WS | B | L | LCM | Pos. angle | r | MU | MP |
| 6 | 191 | 4 | 137 | -7.82 | 152.97 | 44.38 | 253.13 | 0.7264 | -1200.9 | -372.2 | |
| 28 | -1 | 20 | -1 | -8.05 | 152.83 | 44.25 | 252.77 | 0.7256 | -1163.4 | 999999 | |
| 7 | 51 | 5 | 36 | -7.53 | 151.22 | 42.63 | 252.84 | 0.7051 | -867.2 | -448.2 | |
| 0 | 8 | 0 | 5 | -8.49 | 150.42 | 41.84 | 251.20 | 0.6992 | -675.0 | -646.6 | |
| 10 | 361 | 7 | 241 | -7.05 | 149.66 | 41.07 | 252.86 | 0.6847 | -418.4 | -549.9 | |
| 0 | 3 | 0 | 2 | -9.41 | 149.69 | 41.11 | 249.61 | 0.6943 | -651.0 | -492.0 | |
| 31 | -5 | 21 | -5 | -7.53 | 149.03 | 40.44 | 251.91 | 0.6788 | -1371.1 | 999999 | |
| 7 | -5 | 5 | -5 | -7.87 | 148.59 | 40.01 | 251.24 | 0.6749 | -1092.7 | 999999 | |
| 0 | 13 | 0 | 9 | -9.18 | 148.65 | 40.07 | 249.44 | 0.6810 | -396.0 | -425.2 | |
| 0 | 5 | 0 | 3 | -9.44 | 148.32 | 39.74 | 248.91 | 0.6782 | -349.0 | -301.3 | |
| 14 | 43 | 9 | 29 | -9.88 | 147.55 | 38.97 | 247.91 | 0.6710 | 753.6 | 6.7 | |
| 9 | -5 | 6 | -5 | -7.32 | 147.14 | 38.55 | 251.35 | 0.6547 | -1307.0 | 999999 | |
| 8 | -5 | 6 | -5 | -7.64 | 147.12 | 38.54 | 250.87 | 0.6558 | -1231.0 | 999999 | |
| 0 | 3 | 0 | 2 | -8.87 | 146.55 | 37.96 | 248.81 | 0.6541 | -536.0 | -449.8 | |
| 0 | 6 | 0 | 4 | -6.94 | 146.29 | 37.70 | 251.50 | 0.6424 | -442.0 | -418.8 | |
| 0 | 3 | 0 | 2 | -8.13 | 145.85 | 37.27 | 249.53 | 0.6422 | 120.0 | -47.8 | |
| 0 | 6 | 0 | 4 | -6.64 | 145.36 | 36.77 | 251.50 | 0.6293 | 455.0 | 348.8 | |
| 0 | 3 | 0 | 2 | -10.28 | 145.62 | 37.03 | 246.28 | 0.6496 | 461.0 | 347.8 | |
| 0 | 5 | 0 | 3 | -8.04 | 145.09 | 36.51 | 249.26 | 0.6322 | -342.0 | -263.9 | |
| 0 | 4 | 0 | 3 | -7.58 | 144.95 | 36.36 | 249.86 | 0.6283 | 310.0 | 212.6 | |
| 0 | 5 | 0 | 3 | -7.29 | 144.87 | 36.29 | 250.26 | 0.6259 | 368.0 | 224.2 | |
| 0 | 7 | 0 | 4 | -6.75 | 144.57 | 35.99 | 250.93 | 0.6197 | 696.0 | 537.5 | |
| 3 | 9 | 2 | 6 | -8.08 | 144.40 | 35.82 | 248.82 | 0.6236 | 703.2 | 406.0 | |
| 0 | 6 | 0 | 4 | -8.91 | 144.05 | 35.47 | 247.37 | 0.6233 | 691.0 | 501.7 | |
| 5 | 247 | 3 | 153 | -7.12 | 143.38 | 34.80 | 249.72 | 0.6059 | 1068.8 | 515.6 | |
| 17 | -25 | 10 | -25 | -6.82 | 143.16 | 34.58 | 250.06 | 0.6017 | 1610.8 | 999999 | |
| 0 | 7 | 0 | 5 | -9.40 | 143.37 | 34.78 | 246.22 | 0.6173 | 626.0 | 705.4 | |
| 0 | 4 | 0 | 2 | -9.81 | 143.37 | 34.78 | 245.61 | 0.6195 | 550.0 | 505.5 | |
| 0 | 5 | 0 | 3 | -10.32 | 143.09 | 34.51 | 244.67 | 0.6189 | 524.0 | 576.3 | |
| 13 | -25 | 8 | -25 | -7.19 | 142.61 | 34.03 | 249.16 | 0.5963 | 1431.0 | 999999 | |
| 7 | 14 | 4 | 9 | -7.98 | 142.15 | 33.57 | 247.65 | 0.5943 | 875.4 | 588.5 | |
| 0 | 4 | 0 | 2 | -8.77 | 141.70 | 33.12 | 246.13 | 0.5927 | 698.0 | 664.4 | |
| 0 | 4 | 0 | 3 | -7.45 | 141.53 | 32.95 | 248.09 | 0.5835 | 606.0 | 534.2 | |
| 0 | 4 | 0 | 2 | -9.08 | 141.55 | 32.96 | 245.53 | 0.5925 | 882.0 | 727.3 | |
| 0 | 12 | 0 | 7 | -7.14 | 141.08 | 32.50 | 248.31 | 0.5759 | 887.0 | 777.0 | |
| Proj. U | - Projected umbra area in millionths of solar disc, negative values indicate | |
|
that the umbra consists of fragmented regions which cannot be separated without losing umbral area. In this way several spots (intensity minima in the umbra) have a common umbra, e.g. -2 means that the given spot shares an umbra with spot No.2, and the common U value is indicated at spot No.2. |
||
| Proj. WS | - Projected whole spot area in millionths of solar disc, negative values indicate | |
|
that several umbras have a common penumbra, e.g. -7 means that the given umbra shares a penumbra with umbra No.7, and the WS value is indicated at No.7. |
||
| Corr. U | - Corrected umbra area in millionths of solar hemisphere, for negative values see above | |
| Corr. WS | - Corrected whole spot area in millionths of solar hemisphere, for negative values see above | |
| B | - Heliographic latitude B; positive: North, negative: South | |
| L | - Heliographic longitude L | |
| LCM | - Longitudinal distance from the Sun's central meridian | |
| Pos. angle | - Position angle | |
| r | - Distance from the centre of Sun's disc in terms of Sun's radius | |
| MU | - Mean magnetic field within the umbra contour averaged the pixel values with sign. | |
| MP | - Mean magnetic field within the penumbra contour averaged the pixel values with sign. | |