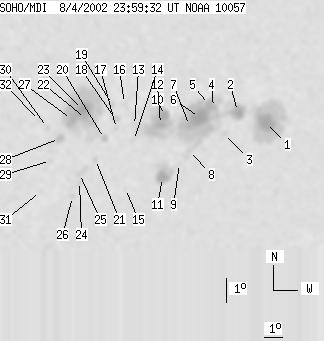
SOHO MDI 2002-08-04 23:59:32 UT
| group | Proj. U | Proj. WS | Corr. U | Corr. WS | B | L | LCM | Pos. angle | r | MU | MP |
| 159 | 989 | 107 | 663 | -7.73 | 147.77 | 40.07 | 251.34 | 0.6740 | -409.7 | -135.8 | |
|
previous
or next observation for the same group /
back to the solar disc SOHO MDI 2002-08-04 23:59:32 UT |
| spot | Proj. U | Proj. WS | Corr. U | Corr. WS | B | L | LCM | Pos. angle | r | MU | MP |
| 28 | 180 | 20 | 131 | -8.05 | 152.96 | 45.26 | 253.16 | 0.7371 | -1167.2 | -422.0 | |
| 18 | 53 | 12 | 37 | -7.47 | 151.26 | 43.55 | 253.28 | 0.7157 | -769.7 | -345.3 | |
| 0 | 5 | 0 | 3 | -8.32 | 150.65 | 42.95 | 251.89 | 0.7116 | -821.0 | -527.4 | |
| 3 | 230 | 2 | 157 | -7.21 | 149.91 | 42.21 | 253.10 | 0.6989 | -806.9 | -467.0 | |
| 6 | -4 | 4 | -4 | -7.07 | 149.68 | 41.98 | 253.20 | 0.6957 | -521.6 | 999999 | |
| 33 | -4 | 22 | -4 | -7.56 | 149.20 | 41.50 | 252.32 | 0.6917 | -1356.1 | 999999 | |
| 5 | -4 | 4 | -4 | -7.85 | 148.71 | 41.00 | 251.71 | 0.6869 | -1154.4 | 999999 | |
| 0 | 12 | 0 | 8 | -8.88 | 148.84 | 41.14 | 250.34 | 0.6925 | -443.0 | -436.4 | |
| 0 | 2 | 0 | 2 | -9.38 | 148.38 | 40.67 | 249.45 | 0.6891 | -620.0 | -525.9 | |
| 8 | 108 | 6 | 72 | -7.35 | 147.34 | 39.63 | 251.80 | 0.6682 | -1397.6 | -821.0 | |
| 13 | 48 | 9 | 32 | -9.89 | 147.56 | 39.85 | 248.33 | 0.6816 | 817.9 | 41.8 | |
| 6 | -10 | 4 | -10 | -7.70 | 147.17 | 39.47 | 251.22 | 0.6676 | -1449.1 | 999999 | |
| 0 | 2 | 0 | 1 | -7.65 | 145.83 | 38.13 | 250.65 | 0.6508 | -381.0 | -355.4 | |
| 0 | 4 | 0 | 3 | -8.26 | 145.84 | 38.14 | 249.77 | 0.6537 | -44.0 | -79.2 | |
| 0 | 3 | 0 | 2 | -10.22 | 145.69 | 37.98 | 246.90 | 0.6608 | 336.0 | 341.5 | |
| 0 | 4 | 0 | 3 | -6.72 | 145.23 | 37.53 | 251.74 | 0.6393 | 325.0 | 274.7 | |
| 0 | 4 | 0 | 2 | -7.72 | 144.92 | 37.22 | 250.11 | 0.6397 | 448.0 | 336.3 | |
| 0 | 6 | 0 | 4 | -7.30 | 144.83 | 37.13 | 250.67 | 0.6368 | 743.0 | 487.0 | |
| 0 | 5 | 0 | 3 | -6.72 | 144.63 | 36.93 | 251.44 | 0.6317 | 886.0 | 665.9 | |
| 3 | 268 | 2 | 168 | -8.09 | 144.36 | 36.66 | 249.26 | 0.6344 | 674.0 | 522.9 | |
| 0 | 6 | 0 | 4 | -8.92 | 144.01 | 36.30 | 247.83 | 0.6339 | 748.0 | 481.7 | |
| 4 | -20 | 2 | -20 | -7.21 | 143.33 | 35.63 | 250.03 | 0.6172 | 997.9 | 999999 | |
| 13 | -20 | 8 | -20 | -6.83 | 143.15 | 35.45 | 250.51 | 0.6131 | 1579.0 | 999999 | |
| 0 | 5 | 0 | 3 | -9.77 | 143.32 | 35.61 | 246.17 | 0.6296 | 661.0 | 555.5 | |
| 0 | 12 | 0 | 8 | -9.44 | 143.28 | 35.57 | 246.63 | 0.6274 | 728.0 | 632.8 | |
| 0 | 4 | 0 | 2 | -10.37 | 143.05 | 35.34 | 245.12 | 0.6295 | 618.0 | 557.1 | |
| 13 | -20 | 8 | -20 | -7.20 | 142.65 | 34.95 | 249.66 | 0.6083 | 1399.5 | 999999 | |
| 6 | 11 | 4 | 7 | -7.94 | 142.13 | 34.43 | 248.22 | 0.6053 | 945.1 | 689.9 | |
| 0 | 4 | 0 | 2 | -8.82 | 141.79 | 34.08 | 246.66 | 0.6054 | 761.0 | 668.6 | |
| 0 | 5 | 0 | 3 | -7.46 | 141.51 | 33.81 | 248.60 | 0.5948 | 670.0 | 483.0 | |
| 0 | 2 | 0 | 2 | -10.07 | 141.44 | 33.74 | 244.54 | 0.6079 | 760.0 | 660.4 | |
| 0 | 6 | 0 | 4 | -7.15 | 141.10 | 33.40 | 248.84 | 0.5878 | 1043.0 | 792.6 | |
| Proj. U | - Projected umbra area in millionths of solar disc, negative values indicate | |
|
that the umbra consists of fragmented regions which cannot be separated without losing umbral area. In this way several spots (intensity minima in the umbra) have a common umbra, e.g. -2 means that the given spot shares an umbra with spot No.2, and the common U value is indicated at spot No.2. |
||
| Proj. WS | - Projected whole spot area in millionths of solar disc, negative values indicate | |
|
that several umbras have a common penumbra, e.g. -7 means that the given umbra shares a penumbra with umbra No.7, and the WS value is indicated at No.7. |
||
| Corr. U | - Corrected umbra area in millionths of solar hemisphere, for negative values see above | |
| Corr. WS | - Corrected whole spot area in millionths of solar hemisphere, for negative values see above | |
| B | - Heliographic latitude B; positive: North, negative: South | |
| L | - Heliographic longitude L | |
| LCM | - Longitudinal distance from the Sun's central meridian | |
| Pos. angle | - Position angle | |
| r | - Distance from the centre of Sun's disc in terms of Sun's radius | |
| MU | - Mean magnetic field within the umbra contour averaged the pixel values with sign. | |
| MP | - Mean magnetic field within the penumbra contour averaged the pixel values with sign. | |