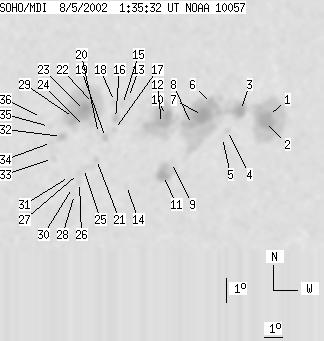
SOHO MDI 2002-08-05 01:35:32 UT
| group | Proj. U | Proj. WS | Corr. U | Corr. WS | B | L | LCM | Pos. angle | r | MU | MP |
| 172 | 1052 | 116 | 718 | -7.71 | 148.26 | 41.44 | 251.99 | 0.6906 | -256.2 | -163.5 | |
|
previous
or next observation for the same group /
back to the solar disc SOHO MDI 2002-08-05 01:35:32 UT |
| spot | Proj. U | Proj. WS | Corr. U | Corr. WS | B | L | LCM | Pos. angle | r | MU | MP |
| 6 | 680 | 5 | 481 | -7.84 | 153.12 | 46.30 | 253.80 | 0.7481 | -1088.4 | -493.1 | |
| 23 | -1 | 17 | -1 | -8.07 | 152.98 | 46.16 | 253.45 | 0.7473 | -1121.5 | 999999 | |
| 12 | -1 | 8 | -1 | -7.51 | 151.48 | 44.66 | 253.64 | 0.7285 | -1008.7 | 999999 | |
| 0 | 5 | 0 | 3 | -8.27 | 150.85 | 44.03 | 252.39 | 0.7240 | -688.0 | -477.5 | |
| 0 | 3 | 0 | 2 | -8.54 | 150.61 | 43.79 | 251.94 | 0.7222 | -621.0 | -468.1 | |
| 10 | -1 | 7 | -1 | -7.10 | 149.82 | 43.00 | 253.56 | 0.7079 | -555.0 | 999999 | |
| 28 | -1 | 20 | -1 | -7.56 | 149.38 | 42.56 | 252.77 | 0.7043 | -1251.6 | 999999 | |
| 6 | -1 | 4 | -1 | -7.88 | 148.83 | 42.01 | 252.09 | 0.6990 | -1073.8 | 999999 | |
| 0 | 5 | 0 | 3 | -9.37 | 147.95 | 41.13 | 249.67 | 0.6945 | -368.0 | -427.8 | |
| 8 | -1 | 5 | -1 | -7.42 | 147.44 | 40.62 | 252.14 | 0.6806 | -1410.6 | 999999 | |
| 14 | 44 | 10 | 30 | -9.87 | 147.60 | 40.78 | 248.81 | 0.6925 | 845.7 | 142.3 | |
| 10 | -1 | 7 | -1 | -7.72 | 147.21 | 40.39 | 251.61 | 0.6790 | -1366.2 | 999999 | |
| 0 | 3 | 0 | 2 | -6.54 | 145.38 | 38.56 | 252.48 | 0.6517 | 490.0 | 444.1 | |
| 0 | 4 | 0 | 2 | -10.15 | 145.70 | 38.88 | 247.47 | 0.6713 | 191.0 | 255.8 | |
| 0 | 5 | 0 | 3 | -6.81 | 145.10 | 38.28 | 251.96 | 0.6492 | 403.0 | 381.8 | |
| 4 | 11 | 2 | 7 | -7.36 | 144.80 | 37.98 | 251.01 | 0.6477 | 608.4 | 383.5 | |
| 0 | 5 | 0 | 3 | -7.80 | 144.79 | 37.97 | 250.35 | 0.6495 | 604.0 | 416.2 | |
| 0 | 5 | 0 | 3 | -6.66 | 144.68 | 37.86 | 251.98 | 0.6433 | 839.0 | 670.7 | |
| 3 | 7 | 2 | 4 | -8.10 | 144.37 | 37.55 | 249.70 | 0.6456 | 691.9 | 477.9 | |
| 0 | 5 | 0 | 3 | -7.91 | 144.00 | 37.18 | 249.79 | 0.6401 | -561.0 | -295.8 | |
| 0 | 4 | 0 | 3 | -8.97 | 144.02 | 37.20 | 248.24 | 0.6452 | 606.0 | 380.1 | |
| 4 | 202 | 2 | 128 | -6.67 | 143.63 | 36.81 | 251.45 | 0.6299 | 795.5 | 653.5 | |
| 26 | -22 | 17 | -22 | -6.93 | 143.20 | 36.38 | 250.85 | 0.6256 | 1439.2 | 999999 | |
| 0 | 3 | 0 | 2 | -7.58 | 143.26 | 36.44 | 249.90 | 0.6293 | 283.0 | 299.8 | |
| 0 | 11 | 0 | 7 | -9.30 | 143.40 | 36.58 | 247.42 | 0.6392 | 809.0 | 509.4 | |
| 0 | 4 | 0 | 3 | -9.87 | 143.27 | 36.45 | 246.53 | 0.6405 | 712.0 | 581.3 | |
| 0 | 5 | 0 | 3 | -9.49 | 143.18 | 36.36 | 247.02 | 0.6374 | 766.0 | 733.4 | |
| 0 | 3 | 0 | 2 | -10.35 | 143.09 | 36.27 | 245.72 | 0.6407 | 501.0 | 506.2 | |
| 12 | -22 | 7 | -22 | -7.18 | 142.68 | 35.86 | 250.20 | 0.6200 | 1442.2 | 999999 | |
| 0 | 2 | 0 | 2 | -10.05 | 142.95 | 36.13 | 246.07 | 0.6374 | 840.0 | 741.5 | |
| 0 | 4 | 0 | 2 | -9.58 | 142.74 | 35.92 | 246.62 | 0.6325 | 626.0 | 500.8 | |
| 6 | 12 | 3 | 7 | -7.92 | 142.16 | 35.34 | 248.78 | 0.6168 | 925.9 | 696.2 | |
| 0 | 5 | 0 | 3 | -8.79 | 141.81 | 34.99 | 247.25 | 0.6167 | 630.0 | 676.5 | |
| 0 | 3 | 0 | 2 | -8.13 | 141.69 | 34.87 | 248.19 | 0.6119 | 808.0 | 675.2 | |
| 0 | 3 | 0 | 2 | -7.47 | 141.53 | 34.71 | 249.11 | 0.6066 | 503.0 | 498.5 | |
| 0 | 9 | 0 | 6 | -7.08 | 141.11 | 34.29 | 249.48 | 0.5992 | 767.0 | 673.2 | |
| Proj. U | - Projected umbra area in millionths of solar disc, negative values indicate | |
|
that the umbra consists of fragmented regions which cannot be separated without losing umbral area. In this way several spots (intensity minima in the umbra) have a common umbra, e.g. -2 means that the given spot shares an umbra with spot No.2, and the common U value is indicated at spot No.2. |
||
| Proj. WS | - Projected whole spot area in millionths of solar disc, negative values indicate | |
|
that several umbras have a common penumbra, e.g. -7 means that the given umbra shares a penumbra with umbra No.7, and the WS value is indicated at No.7. |
||
| Corr. U | - Corrected umbra area in millionths of solar hemisphere, for negative values see above | |
| Corr. WS | - Corrected whole spot area in millionths of solar hemisphere, for negative values see above | |
| B | - Heliographic latitude B; positive: North, negative: South | |
| L | - Heliographic longitude L | |
| LCM | - Longitudinal distance from the Sun's central meridian | |
| Pos. angle | - Position angle | |
| r | - Distance from the centre of Sun's disc in terms of Sun's radius | |
| MU | - Mean magnetic field within the umbra contour averaged the pixel values with sign. | |
| MP | - Mean magnetic field within the penumbra contour averaged the pixel values with sign. | |