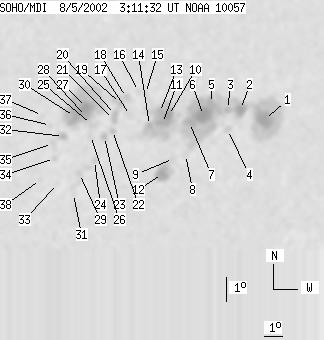
SOHO MDI 2002-08-05 03:11:32 UT
| group | Proj. U | Proj. WS | Corr. U | Corr. WS | B | L | LCM | Pos. angle | r | MU | MP |
| 201 | 1050 | 136 | 724 | -7.71 | 147.88 | 41.94 | 252.19 | 0.6966 | -356.3 | -145.0 | |
|
previous
or next observation for the same group /
back to the solar disc SOHO MDI 2002-08-05 03:11:32 UT |
| spot | Proj. U | Proj. WS | Corr. U | Corr. WS | B | L | LCM | Pos. angle | r | MU | MP |
| 28 | 479 | 21 | 348 | -8.02 | 153.08 | 47.14 | 253.86 | 0.7579 | -1095.8 | -413.1 | |
| 14 | -1 | 10 | -1 | -7.50 | 151.61 | 45.67 | 254.01 | 0.7400 | -897.6 | 999999 | |
| 4 | -1 | 3 | -1 | -7.45 | 150.86 | 44.92 | 253.82 | 0.7314 | -822.3 | 999999 | |
| 0 | 6 | 0 | 5 | -8.27 | 150.97 | 45.04 | 252.78 | 0.7354 | -604.0 | -437.1 | |
| 9 | -1 | 6 | -1 | -7.13 | 149.92 | 43.98 | 253.89 | 0.7196 | -666.8 | 999999 | |
| 28 | -1 | 20 | -1 | -7.59 | 149.54 | 43.60 | 253.13 | 0.7166 | -1222.5 | 999999 | |
| 12 | -1 | 8 | -1 | -7.82 | 148.80 | 42.86 | 252.53 | 0.7088 | -1138.9 | 999999 | |
| 0 | 6 | 0 | 4 | -9.12 | 148.76 | 42.82 | 250.76 | 0.7131 | -471.0 | -415.6 | |
| 0 | 9 | 0 | 6 | -9.23 | 148.12 | 42.18 | 250.33 | 0.7062 | -750.0 | -511.9 | |
| 9 | 153 | 6 | 104 | -7.45 | 147.61 | 41.68 | 252.55 | 0.6934 | -1310.8 | -726.8 | |
| 12 | -10 | 8 | -10 | -7.75 | 147.33 | 41.39 | 252.01 | 0.6912 | -1373.3 | 999999 | |
| 20 | 40 | 14 | 28 | -9.81 | 147.61 | 41.68 | 249.32 | 0.7027 | 674.8 | 148.6 | |
| 8 | -10 | 5 | -10 | -7.29 | 147.12 | 41.18 | 252.56 | 0.6869 | -1173.4 | 999999 | |
| 3 | -10 | 2 | -10 | -7.78 | 146.64 | 40.71 | 251.66 | 0.6830 | -1114.7 | 999999 | |
| 0 | 12 | 0 | 8 | -6.46 | 146.29 | 40.35 | 253.38 | 0.6737 | -147.0 | -255.0 | |
| 0 | 3 | 0 | 2 | -6.36 | 145.92 | 39.98 | 253.37 | 0.6687 | 183.0 | 227.1 | |
| 0 | 13 | 0 | 8 | -7.30 | 145.59 | 39.66 | 251.87 | 0.6684 | -260.0 | -267.8 | |
| 0 | 7 | 0 | 4 | -6.56 | 145.31 | 39.37 | 252.82 | 0.6620 | 544.0 | 378.6 | |
| 2 | 11 | 1 | 7 | -6.78 | 145.02 | 39.09 | 252.37 | 0.6592 | 637.2 | 601.5 | |
| 3 | 13 | 2 | 9 | -7.21 | 144.81 | 38.87 | 251.65 | 0.6583 | 554.0 | 275.4 | |
| 3 | -20 | 2 | -20 | -7.41 | 144.73 | 38.79 | 251.32 | 0.6581 | 632.2 | 999999 | |
| 2 | 7 | 1 | 5 | -7.85 | 144.73 | 38.79 | 250.68 | 0.6599 | 442.5 | 252.6 | |
| 4 | 9 | 2 | 6 | -8.07 | 144.34 | 38.40 | 250.17 | 0.6561 | 649.9 | 428.0 | |
| 0 | 6 | 0 | 4 | -9.02 | 143.94 | 38.01 | 248.60 | 0.6554 | 406.0 | 328.2 | |
| 0 | 10 | 0 | 6 | -7.54 | 143.62 | 37.68 | 250.60 | 0.6448 | 540.0 | 189.3 | |
| 0 | 8 | 0 | 5 | -7.98 | 143.62 | 37.68 | 249.94 | 0.6467 | 31.0 | -128.9 | |
| 15 | 186 | 9 | 119 | -6.83 | 143.30 | 37.36 | 251.49 | 0.6377 | 1496.3 | 676.2 | |
| 5 | -27 | 3 | -27 | -7.19 | 143.34 | 37.40 | 250.96 | 0.6397 | 942.9 | 999999 | |
| 0 | 32 | 0 | 21 | -9.51 | 143.24 | 37.31 | 247.52 | 0.6492 | 981.0 | 567.6 | |
| 15 | -27 | 10 | -27 | -7.15 | 142.73 | 36.79 | 250.72 | 0.6318 | 1504.4 | 999999 | |
| 0 | 2 | 0 | 2 | -10.31 | 143.05 | 37.11 | 246.26 | 0.6508 | 534.0 | 450.8 | |
| 5 | 10 | 3 | 6 | -7.93 | 142.26 | 36.32 | 249.30 | 0.6294 | 910.0 | 618.6 | |
| 0 | 2 | 0 | 1 | -9.85 | 142.18 | 36.25 | 246.43 | 0.6378 | 488.0 | 461.7 | |
| 0 | 4 | 0 | 2 | -8.81 | 141.91 | 35.97 | 247.80 | 0.6292 | 741.0 | 580.5 | |
| 0 | 9 | 0 | 6 | -8.19 | 141.74 | 35.80 | 248.63 | 0.6241 | 738.0 | 649.3 | |
| 0 | 4 | 0 | 2 | -7.44 | 141.57 | 35.63 | 249.66 | 0.6183 | 651.0 | 436.6 | |
| 0 | 6 | 0 | 4 | -7.01 | 141.14 | 35.20 | 250.09 | 0.6107 | 733.0 | 645.4 | |
| 0 | 3 | 0 | 2 | -9.63 | 141.31 | 35.37 | 246.23 | 0.6259 | 468.0 | 507.2 | |
| Proj. U | - Projected umbra area in millionths of solar disc, negative values indicate | |
|
that the umbra consists of fragmented regions which cannot be separated without losing umbral area. In this way several spots (intensity minima in the umbra) have a common umbra, e.g. -2 means that the given spot shares an umbra with spot No.2, and the common U value is indicated at spot No.2. |
||
| Proj. WS | - Projected whole spot area in millionths of solar disc, negative values indicate | |
|
that several umbras have a common penumbra, e.g. -7 means that the given umbra shares a penumbra with umbra No.7, and the WS value is indicated at No.7. |
||
| Corr. U | - Corrected umbra area in millionths of solar hemisphere, for negative values see above | |
| Corr. WS | - Corrected whole spot area in millionths of solar hemisphere, for negative values see above | |
| B | - Heliographic latitude B; positive: North, negative: South | |
| L | - Heliographic longitude L | |
| LCM | - Longitudinal distance from the Sun's central meridian | |
| Pos. angle | - Position angle | |
| r | - Distance from the centre of Sun's disc in terms of Sun's radius | |
| MU | - Mean magnetic field within the umbra contour averaged the pixel values with sign. | |
| MP | - Mean magnetic field within the penumbra contour averaged the pixel values with sign. | |