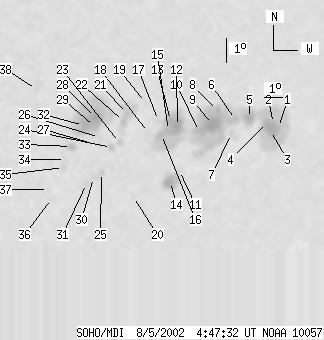
SOHO MDI 2002-08-05 04:47:32 UT
| group | Proj. U | Proj. WS | Corr. U | Corr. WS | B | L | LCM | Pos. angle | r | MU | MP |
| 190 | 1003 | 132 | 703 | -7.65 | 147.89 | 42.84 | 252.65 | 0.7068 | -315.5 | -149.8 | |
|
previous
or next observation for the same group /
back to the solar disc SOHO MDI 2002-08-05 04:47:32 UT |
| spot | Proj. U | Proj. WS | Corr. U | Corr. WS | B | L | LCM | Pos. angle | r | MU | MP |
| 4 | 456 | 3 | 336 | -8.01 | 153.56 | 48.51 | 254.33 | 0.7726 | -577.2 | -432.5 | |
| 4 | -1 | 3 | -1 | -7.82 | 153.23 | 48.18 | 254.46 | 0.7686 | -1040.5 | 999999 | |
| 13 | -1 | 10 | -1 | -8.10 | 153.10 | 48.04 | 254.07 | 0.7679 | -1083.2 | 999999 | |
| 3 | -1 | 2 | -1 | -7.75 | 152.80 | 47.75 | 254.41 | 0.7637 | -1274.0 | 999999 | |
| 10 | -1 | 7 | -1 | -7.50 | 151.76 | 46.71 | 254.37 | 0.7516 | -1016.6 | 999999 | |
| 3 | -1 | 2 | -1 | -7.48 | 150.95 | 45.89 | 254.12 | 0.7425 | -851.5 | 999999 | |
| 0 | 9 | 0 | 7 | -8.04 | 150.80 | 45.74 | 253.34 | 0.7425 | 301.0 | -144.8 | |
| 5 | -1 | 4 | -1 | -7.03 | 149.86 | 44.81 | 254.32 | 0.7288 | -382.0 | 999999 | |
| 29 | -1 | 21 | -1 | -7.58 | 149.65 | 44.60 | 253.51 | 0.7281 | -1213.5 | 999999 | |
| 11 | -1 | 8 | -1 | -7.81 | 148.96 | 43.90 | 252.94 | 0.7209 | -1077.9 | 999999 | |
| 0 | 4 | 0 | 3 | -9.34 | 148.07 | 43.01 | 250.55 | 0.7162 | -772.0 | -637.2 | |
| 17 | 157 | 12 | 109 | -7.52 | 147.71 | 42.65 | 252.85 | 0.7053 | -1351.3 | -705.5 | |
| 8 | -12 | 5 | -12 | -7.24 | 147.30 | 42.24 | 253.06 | 0.6995 | -1092.4 | 999999 | |
| 15 | 40 | 11 | 28 | -9.75 | 147.64 | 42.59 | 249.80 | 0.7129 | 712.3 | 144.6 | |
| 6 | -12 | 4 | -12 | -7.64 | 147.24 | 42.18 | 252.48 | 0.7002 | -1437.7 | 999999 | |
| 4 | -12 | 3 | -12 | -7.78 | 146.88 | 41.82 | 252.14 | 0.6964 | -1215.8 | 999999 | |
| 0 | 6 | 0 | 4 | -7.20 | 146.65 | 41.59 | 252.85 | 0.6915 | -606.0 | -494.5 | |
| 0 | 7 | 0 | 4 | -7.65 | 146.17 | 41.11 | 252.02 | 0.6874 | -517.0 | -503.7 | |
| 0 | 5 | 0 | 3 | -6.41 | 145.87 | 40.82 | 253.64 | 0.6793 | 311.0 | 330.0 | |
| 0 | 4 | 0 | 3 | -10.23 | 145.72 | 40.67 | 248.27 | 0.6927 | 159.0 | 178.6 | |
| 4 | 51 | 2 | 34 | -6.79 | 144.97 | 39.91 | 252.71 | 0.6696 | 525.3 | 387.3 | |
| 3 | -21 | 2 | -21 | -7.11 | 144.79 | 39.74 | 252.19 | 0.6686 | 587.7 | 999999 | |
| 2 | 6 | 2 | 4 | -7.95 | 144.68 | 39.62 | 250.93 | 0.6706 | 471.2 | 268.7 | |
| 4 | 8 | 2 | 5 | -8.13 | 144.28 | 39.23 | 250.49 | 0.6665 | 620.7 | 393.3 | |
| 0 | 8 | 0 | 5 | -9.12 | 143.89 | 38.83 | 248.89 | 0.6660 | 469.0 | 307.2 | |
| 0 | 3 | 0 | 2 | -7.67 | 143.62 | 38.56 | 250.82 | 0.6563 | 541.0 | 428.4 | |
| 0 | 2 | 0 | 2 | -8.00 | 143.60 | 38.54 | 250.34 | 0.6575 | 331.0 | 212.4 | |
| 15 | 184 | 10 | 119 | -6.84 | 143.33 | 38.27 | 251.89 | 0.6493 | 1369.6 | 664.9 | |
| 7 | -28 | 4 | -28 | -7.21 | 143.31 | 38.25 | 251.35 | 0.6506 | 862.0 | 999999 | |
| 0 | 7 | 0 | 5 | -9.30 | 143.50 | 38.45 | 248.44 | 0.6621 | 653.0 | 517.7 | |
| 0 | 4 | 0 | 3 | -9.52 | 143.17 | 38.12 | 247.94 | 0.6591 | 976.0 | 798.1 | |
| 18 | -28 | 12 | -28 | -7.13 | 142.75 | 37.69 | 251.19 | 0.6431 | 1510.4 | 999999 | |
| 5 | 11 | 3 | 7 | -7.95 | 142.23 | 37.17 | 249.72 | 0.6402 | 858.1 | 555.3 | |
| 0 | 4 | 0 | 3 | -8.46 | 141.98 | 36.92 | 248.84 | 0.6395 | 536.0 | 508.2 | |
| 0 | 6 | 0 | 4 | -8.78 | 141.92 | 36.86 | 248.33 | 0.6402 | 672.0 | 582.5 | |
| 0 | 5 | 0 | 3 | -10.02 | 141.47 | 36.41 | 246.27 | 0.6408 | 725.0 | 594.7 | |
| 0 | 3 | 0 | 2 | -9.64 | 141.27 | 36.22 | 246.71 | 0.6364 | 576.0 | 516.9 | |
| 0 | 13 | 0 | 8 | -5.52 | 140.28 | 35.23 | 252.44 | 0.6044 | 761.0 | 571.7 | |
| Proj. U | - Projected umbra area in millionths of solar disc, negative values indicate | |
|
that the umbra consists of fragmented regions which cannot be separated without losing umbral area. In this way several spots (intensity minima in the umbra) have a common umbra, e.g. -2 means that the given spot shares an umbra with spot No.2, and the common U value is indicated at spot No.2. |
||
| Proj. WS | - Projected whole spot area in millionths of solar disc, negative values indicate | |
|
that several umbras have a common penumbra, e.g. -7 means that the given umbra shares a penumbra with umbra No.7, and the WS value is indicated at No.7. |
||
| Corr. U | - Corrected umbra area in millionths of solar hemisphere, for negative values see above | |
| Corr. WS | - Corrected whole spot area in millionths of solar hemisphere, for negative values see above | |
| B | - Heliographic latitude B; positive: North, negative: South | |
| L | - Heliographic longitude L | |
| LCM | - Longitudinal distance from the Sun's central meridian | |
| Pos. angle | - Position angle | |
| r | - Distance from the centre of Sun's disc in terms of Sun's radius | |
| MU | - Mean magnetic field within the umbra contour averaged the pixel values with sign. | |
| MP | - Mean magnetic field within the penumbra contour averaged the pixel values with sign. | |