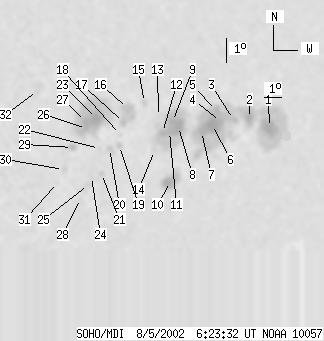
SOHO MDI 2002-08-05 06:23:32 UT
| group | Proj. U | Proj. WS | Corr. U | Corr. WS | B | L | LCM | Pos. angle | r | MU | MP |
| 198 | 1020 | 138 | 727 | -7.59 | 148.12 | 43.94 | 253.18 | 0.7194 | -399.6 | -139.4 | |
|
previous
or next observation for the same group /
back to the solar disc SOHO MDI 2002-08-05 06:23:32 UT |
| spot | Proj. U | Proj. WS | Corr. U | Corr. WS | B | L | LCM | Pos. angle | r | MU | MP |
| 28 | 486 | 22 | 365 | -7.97 | 153.16 | 48.99 | 254.54 | 0.7776 | -1001.8 | -385.6 | |
| 11 | -1 | 8 | -1 | -7.50 | 151.89 | 47.71 | 254.71 | 0.7626 | -1050.0 | 999999 | |
| 3 | -1 | 2 | -1 | -7.46 | 150.94 | 46.76 | 254.44 | 0.7521 | -869.2 | 999999 | |
| 5 | -1 | 3 | -1 | -7.48 | 150.18 | 46.01 | 254.15 | 0.7438 | -880.3 | 999999 | |
| 7 | -1 | 5 | -1 | -7.02 | 149.89 | 45.72 | 254.66 | 0.7391 | -505.5 | 999999 | |
| 30 | -1 | 22 | -1 | -7.57 | 149.74 | 45.56 | 253.88 | 0.7391 | -1190.9 | 999999 | |
| 9 | -1 | 7 | -1 | -7.81 | 149.14 | 44.97 | 253.35 | 0.7331 | -1145.1 | 999999 | |
| 17 | 160 | 12 | 113 | -7.51 | 147.82 | 43.64 | 253.25 | 0.7169 | -1327.3 | -664.4 | |
| 7 | -8 | 5 | -8 | -7.28 | 147.46 | 43.28 | 253.42 | 0.7119 | -1389.7 | 999999 | |
| 19 | 46 | 13 | 33 | -9.74 | 147.70 | 43.52 | 250.23 | 0.7236 | 549.7 | 18.9 | |
| 5 | -8 | 3 | -8 | -7.67 | 147.34 | 43.17 | 252.84 | 0.7119 | -1415.3 | 999999 | |
| 5 | -8 | 3 | -8 | -7.68 | 146.96 | 42.79 | 252.67 | 0.7075 | -1212.2 | 999999 | |
| 0 | 4 | 0 | 2 | -7.01 | 146.66 | 42.49 | 253.47 | 0.7016 | -488.0 | -465.2 | |
| 0 | 5 | 0 | 3 | -8.39 | 146.62 | 42.44 | 251.57 | 0.7060 | -499.0 | -432.9 | |
| 0 | 7 | 0 | 5 | -6.39 | 145.84 | 41.67 | 254.01 | 0.6896 | 498.0 | 353.7 | |
| 8 | 45 | 5 | 31 | -6.57 | 144.96 | 40.78 | 253.40 | 0.6794 | 765.0 | 304.9 | |
| 4 | -16 | 2 | -16 | -7.12 | 144.80 | 40.63 | 252.55 | 0.6796 | 582.7 | 999999 | |
| 0 | 3 | 0 | 2 | -7.60 | 144.70 | 40.53 | 251.83 | 0.6802 | 457.0 | 300.5 | |
| 2 | 6 | 1 | 4 | -8.05 | 144.70 | 40.53 | 251.20 | 0.6820 | 477.8 | 426.4 | |
| 0 | 9 | 0 | 6 | -8.14 | 144.19 | 40.01 | 250.84 | 0.6761 | 623.0 | 483.8 | |
| 0 | 5 | 0 | 3 | -9.13 | 143.90 | 39.72 | 249.30 | 0.6768 | 394.0 | 262.1 | |
| 0 | 3 | 0 | 2 | -8.10 | 143.66 | 39.49 | 250.65 | 0.6695 | 282.0 | 3.3 | |
| 25 | 181 | 17 | 119 | -6.86 | 143.37 | 39.20 | 252.29 | 0.6610 | 1247.4 | 650.9 | |
| 0 | 8 | 0 | 5 | -9.22 | 143.39 | 39.21 | 248.93 | 0.6710 | 598.0 | 569.6 | |
| 0 | 10 | 0 | 7 | -9.54 | 143.27 | 39.10 | 248.42 | 0.6711 | 794.0 | 684.2 | |
| 3 | -23 | 2 | -23 | -7.23 | 142.89 | 38.72 | 251.53 | 0.6565 | 1320.8 | 999999 | |
| 6 | -23 | 4 | -23 | -6.94 | 142.81 | 38.64 | 251.91 | 0.6544 | 1743.9 | 999999 | |
| 0 | 3 | 0 | 2 | -10.09 | 142.94 | 38.76 | 247.48 | 0.6696 | 538.0 | 566.0 | |
| 4 | 9 | 2 | 6 | -7.96 | 142.26 | 38.08 | 250.16 | 0.6517 | 835.0 | 640.6 | |
| 0 | 6 | 0 | 4 | -8.83 | 141.90 | 37.73 | 248.71 | 0.6512 | 525.0 | 437.3 | |
| 0 | 3 | 0 | 2 | -9.35 | 141.66 | 37.49 | 247.84 | 0.6507 | 599.0 | 572.5 | |
| 0 | 21 | 0 | 13 | -5.53 | 140.29 | 36.11 | 252.85 | 0.6162 | 837.0 | 454.0 | |
| Proj. U | - Projected umbra area in millionths of solar disc, negative values indicate | |
|
that the umbra consists of fragmented regions which cannot be separated without losing umbral area. In this way several spots (intensity minima in the umbra) have a common umbra, e.g. -2 means that the given spot shares an umbra with spot No.2, and the common U value is indicated at spot No.2. |
||
| Proj. WS | - Projected whole spot area in millionths of solar disc, negative values indicate | |
|
that several umbras have a common penumbra, e.g. -7 means that the given umbra shares a penumbra with umbra No.7, and the WS value is indicated at No.7. |
||
| Corr. U | - Corrected umbra area in millionths of solar hemisphere, for negative values see above | |
| Corr. WS | - Corrected whole spot area in millionths of solar hemisphere, for negative values see above | |
| B | - Heliographic latitude B; positive: North, negative: South | |
| L | - Heliographic longitude L | |
| LCM | - Longitudinal distance from the Sun's central meridian | |
| Pos. angle | - Position angle | |
| r | - Distance from the centre of Sun's disc in terms of Sun's radius | |
| MU | - Mean magnetic field within the umbra contour averaged the pixel values with sign. | |
| MP | - Mean magnetic field within the penumbra contour averaged the pixel values with sign. | |