SOHO MDI 2002-08-05 07:59:32 UT
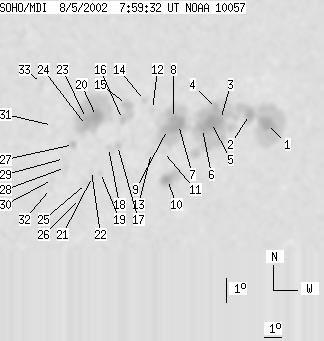
| group | Proj. U | Proj. WS | Corr. U | Corr. WS | B | L | LCM | Pos. angle | r | MU | MP |
| 167 | 977 | 118 | 706 | -7.60 | 148.04 | 44.74 | 253.46 | 0.7288 | -440.9 | -159.1 | |
|
previous
or next observation for the same group /
back to the solar disc SOHO MDI 2002-08-05 07:59:32 UT |
| spot | Proj. U | Proj. WS | Corr. U | Corr. WS | B | L | LCM | Pos. angle | r | MU | MP |
| 22 | 625 | 17 | 469 | -7.92 | 153.20 | 49.91 | 254.89 | 0.7871 | -986.0 | -477.4 | |
| 10 | -1 | 8 | -1 | -7.45 | 152.02 | 48.73 | 255.09 | 0.7735 | -1112.3 | 999999 | |
| 4 | -1 | 3 | -1 | -7.52 | 150.30 | 47.01 | 254.45 | 0.7550 | -820.7 | 999999 | |
| 7 | -1 | 5 | -1 | -7.05 | 150.00 | 46.71 | 254.95 | 0.7503 | -666.8 | 999999 | |
| 22 | -1 | 16 | -1 | -7.60 | 149.78 | 46.49 | 254.17 | 0.7496 | -1251.6 | 999999 | |
| 11 | -1 | 8 | -1 | -7.80 | 149.29 | 46.00 | 253.73 | 0.7447 | -1120.4 | 999999 | |
| 18 | -1 | 13 | -1 | -7.53 | 147.89 | 44.59 | 253.57 | 0.7280 | -1316.7 | 999999 | |
| 7 | -1 | 5 | -1 | -7.27 | 147.57 | 44.28 | 253.81 | 0.7235 | -1495.8 | 999999 | |
| 9 | -1 | 6 | -1 | -7.69 | 147.29 | 44.00 | 253.14 | 0.7217 | -1397.2 | 999999 | |
| 12 | 42 | 9 | 30 | -9.75 | 147.60 | 44.31 | 250.54 | 0.7325 | 706.7 | 15.3 | |
| 0 | 3 | 0 | 2 | -8.58 | 147.19 | 43.90 | 251.92 | 0.7236 | -528.0 | -510.7 | |
| 0 | 6 | 0 | 4 | -6.81 | 146.36 | 43.06 | 253.96 | 0.7078 | -380.0 | -230.6 | |
| 0 | 5 | 0 | 3 | -8.57 | 146.53 | 43.23 | 251.66 | 0.7159 | -442.0 | -455.1 | |
| 0 | 4 | 0 | 3 | -6.41 | 145.88 | 42.59 | 254.33 | 0.7007 | 513.0 | 362.5 | |
| 8 | 40 | 5 | 27 | -6.50 | 144.92 | 41.63 | 253.83 | 0.6895 | 755.1 | 295.6 | |
| 4 | -15 | 2 | -15 | -7.10 | 144.77 | 41.48 | 252.93 | 0.6898 | 663.2 | 999999 | |
| 2 | 8 | 1 | 6 | -8.14 | 144.63 | 41.33 | 251.42 | 0.6920 | 484.9 | 356.4 | |
| 0 | 9 | 0 | 6 | -8.19 | 144.15 | 40.86 | 251.15 | 0.6866 | 646.0 | 570.6 | |
| 0 | 4 | 0 | 2 | -9.19 | 143.86 | 40.57 | 249.63 | 0.6872 | 409.0 | 338.9 | |
| 17 | 178 | 11 | 119 | -6.88 | 143.37 | 40.08 | 252.65 | 0.6720 | 1318.7 | 666.2 | |
| 0 | 4 | 0 | 3 | -9.32 | 143.46 | 40.17 | 249.25 | 0.6829 | 789.0 | 590.3 | |
| 0 | 2 | 0 | 1 | -9.07 | 143.37 | 40.08 | 249.56 | 0.6808 | 574.0 | 518.9 | |
| 6 | -20 | 4 | -20 | -6.92 | 142.86 | 39.57 | 252.36 | 0.6658 | 1662.7 | 999999 | |
| 5 | -20 | 3 | -20 | -7.21 | 142.89 | 39.59 | 251.96 | 0.6673 | 1283.1 | 999999 | |
| 0 | 4 | 0 | 3 | -9.59 | 143.18 | 39.89 | 248.75 | 0.6808 | 915.0 | 777.8 | |
| 0 | 4 | 0 | 3 | -10.19 | 142.96 | 39.66 | 247.81 | 0.6808 | 604.0 | 530.0 | |
| 3 | 8 | 2 | 5 | -7.94 | 142.30 | 39.00 | 250.64 | 0.6630 | 797.8 | 561.5 | |
| 0 | 9 | 0 | 6 | -8.86 | 141.99 | 38.70 | 249.18 | 0.6632 | 465.0 | 387.6 | |
| 0 | 4 | 0 | 3 | -8.48 | 141.90 | 38.60 | 249.67 | 0.6604 | 518.0 | 397.8 | |
| 0 | 4 | 0 | 2 | -9.30 | 141.38 | 38.09 | 248.23 | 0.6579 | 811.0 | 640.2 | |
| 0 | 2 | 0 | 1 | -7.09 | 141.13 | 37.84 | 251.32 | 0.6449 | 679.0 | 538.8 | |
| 0 | 3 | 0 | 2 | -9.67 | 141.33 | 38.04 | 247.68 | 0.6589 | 723.0 | 595.6 | |
| 0 | 9 | 0 | 6 | -5.35 | 140.43 | 37.14 | 253.61 | 0.6289 | 873.0 | 714.0 | |
| Proj. U | - Projected umbra area in millionths of solar disc, negative values indicate | |
|
that the umbra consists of fragmented regions which cannot be separated without losing umbral area. In this way several spots (intensity minima in the umbra) have a common umbra, e.g. -2 means that the given spot shares an umbra with spot No.2, and the common U value is indicated at spot No.2. |
||
| Proj. WS | - Projected whole spot area in millionths of solar disc, negative values indicate | |
|
that several umbras have a common penumbra, e.g. -7 means that the given umbra shares a penumbra with umbra No.7, and the WS value is indicated at No.7. |
||
| Corr. U | - Corrected umbra area in millionths of solar hemisphere, for negative values see above | |
| Corr. WS | - Corrected whole spot area in millionths of solar hemisphere, for negative values see above | |
| B | - Heliographic latitude B; positive: North, negative: South | |
| L | - Heliographic longitude L | |
| LCM | - Longitudinal distance from the Sun's central meridian | |
| Pos. angle | - Position angle | |
| r | - Distance from the centre of Sun's disc in terms of Sun's radius | |
| MU | - Mean magnetic field within the umbra contour averaged the pixel values with sign. | |
| MP | - Mean magnetic field within the penumbra contour averaged the pixel values with sign. | |