SOHO MDI 2002-08-05 09:35:32 UT
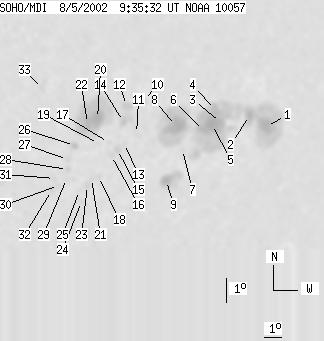
| group | Proj. U | Proj. WS | Corr. U | Corr. WS | B | L | LCM | Pos. angle | r | MU | MP |
| 160 | 1002 | 120 | 738 | -7.63 | 148.08 | 45.67 | 253.75 | 0.7393 | -352.7 | -150.0 | |
|
previous
or next observation for the same group /
back to the solar disc SOHO MDI 2002-08-05 09:35:32 UT |
| spot | Proj. U | Proj. WS | Corr. U | Corr. WS | B | L | LCM | Pos. angle | r | MU | MP |
| 20 | 459 | 16 | 358 | -7.99 | 153.28 | 50.87 | 255.09 | 0.7972 | -891.1 | -399.5 | |
| 8 | -1 | 7 | -1 | -7.45 | 152.12 | 49.71 | 255.40 | 0.7838 | -1113.4 | 999999 | |
| 7 | -1 | 5 | -1 | -7.59 | 150.38 | 47.97 | 254.67 | 0.7657 | -771.9 | 999999 | |
| 8 | -1 | 6 | -1 | -7.03 | 150.00 | 47.59 | 255.26 | 0.7600 | -666.9 | 999999 | |
| 18 | -1 | 14 | -1 | -7.63 | 149.91 | 47.50 | 254.46 | 0.7607 | -1201.1 | 999999 | |
| 10 | -1 | 8 | -1 | -7.84 | 149.40 | 46.99 | 254.03 | 0.7558 | -1103.4 | 999999 | |
| 0 | 4 | 0 | 3 | -8.52 | 148.29 | 45.88 | 252.75 | 0.7456 | -433.0 | -502.0 | |
| 33 | 167 | 24 | 122 | -7.50 | 147.74 | 45.33 | 253.87 | 0.7362 | -1365.1 | -647.8 | |
| 10 | 47 | 8 | 34 | -9.73 | 147.57 | 45.16 | 250.91 | 0.7418 | 720.2 | -11.9 | |
| 0 | 8 | 0 | 6 | -6.34 | 145.81 | 43.40 | 254.72 | 0.7102 | 593.0 | 334.2 | |
| 0 | 7 | 0 | 5 | -7.66 | 145.58 | 43.17 | 252.84 | 0.7119 | -233.0 | -253.7 | |
| 4 | 47 | 3 | 33 | -6.48 | 144.89 | 42.48 | 254.19 | 0.6998 | 888.8 | 351.8 | |
| 0 | 3 | 0 | 2 | -8.02 | 144.97 | 42.56 | 252.11 | 0.7061 | -101.0 | -111.1 | |
| 4 | -12 | 3 | -12 | -7.12 | 144.80 | 42.39 | 253.27 | 0.7009 | 536.8 | 999999 | |
| 0 | 8 | 0 | 6 | -8.24 | 144.62 | 42.21 | 251.66 | 0.7028 | 437.0 | 383.6 | |
| 0 | 4 | 0 | 3 | -8.47 | 144.32 | 41.91 | 251.23 | 0.7001 | 501.0 | 444.2 | |
| 0 | 3 | 0 | 2 | -7.92 | 144.09 | 41.68 | 251.88 | 0.6953 | 524.0 | 448.4 | |
| 0 | 4 | 0 | 3 | -9.28 | 143.74 | 41.33 | 249.86 | 0.6965 | 387.0 | 442.5 | |
| 0 | 3 | 0 | 2 | -7.92 | 143.56 | 41.15 | 251.65 | 0.6890 | 711.0 | 580.4 | |
| 21 | 176 | 14 | 119 | -6.90 | 143.39 | 40.98 | 253.01 | 0.6830 | 1212.5 | 608.8 | |
| 0 | 3 | 0 | 2 | -9.34 | 143.37 | 40.96 | 249.61 | 0.6924 | 692.0 | 606.5 | |
| 13 | -20 | 9 | -20 | -7.06 | 142.88 | 40.47 | 252.55 | 0.6774 | 1493.5 | 999999 | |
| 0 | 6 | 0 | 4 | -9.61 | 143.20 | 40.79 | 249.16 | 0.6915 | 852.0 | 691.5 | |
| 0 | 3 | 0 | 2 | -10.25 | 142.98 | 40.57 | 248.18 | 0.6917 | 525.0 | 481.3 | |
| 0 | 3 | 0 | 2 | -9.79 | 142.80 | 40.39 | 248.72 | 0.6876 | 496.0 | 507.3 | |
| 4 | 9 | 3 | 6 | -7.91 | 142.29 | 39.88 | 251.09 | 0.6736 | 761.1 | 508.2 | |
| 0 | 4 | 0 | 2 | -8.46 | 141.99 | 39.58 | 250.17 | 0.6723 | 417.0 | 423.2 | |
| 0 | 5 | 0 | 3 | -8.87 | 142.05 | 39.64 | 249.62 | 0.6747 | 369.0 | 381.9 | |
| 0 | 5 | 0 | 3 | -9.24 | 142.04 | 39.63 | 249.10 | 0.6762 | 403.0 | 210.6 | |
| 0 | 3 | 0 | 2 | -9.50 | 141.66 | 39.25 | 248.55 | 0.6728 | 677.0 | 558.8 | |
| 0 | 4 | 0 | 3 | -9.20 | 141.41 | 39.00 | 248.85 | 0.6685 | 735.0 | 589.5 | |
| 0 | 5 | 0 | 3 | -9.68 | 141.32 | 38.91 | 248.12 | 0.6696 | 756.0 | 532.2 | |
| 0 | 12 | 0 | 8 | -5.48 | 140.42 | 38.01 | 253.79 | 0.6406 | 888.0 | 690.6 | |
| Proj. U | - Projected umbra area in millionths of solar disc, negative values indicate | |
|
that the umbra consists of fragmented regions which cannot be separated without losing umbral area. In this way several spots (intensity minima in the umbra) have a common umbra, e.g. -2 means that the given spot shares an umbra with spot No.2, and the common U value is indicated at spot No.2. |
||
| Proj. WS | - Projected whole spot area in millionths of solar disc, negative values indicate | |
|
that several umbras have a common penumbra, e.g. -7 means that the given umbra shares a penumbra with umbra No.7, and the WS value is indicated at No.7. |
||
| Corr. U | - Corrected umbra area in millionths of solar hemisphere, for negative values see above | |
| Corr. WS | - Corrected whole spot area in millionths of solar hemisphere, for negative values see above | |
| B | - Heliographic latitude B; positive: North, negative: South | |
| L | - Heliographic longitude L | |
| LCM | - Longitudinal distance from the Sun's central meridian | |
| Pos. angle | - Position angle | |
| r | - Distance from the centre of Sun's disc in terms of Sun's radius | |
| MU | - Mean magnetic field within the umbra contour averaged the pixel values with sign. | |
| MP | - Mean magnetic field within the penumbra contour averaged the pixel values with sign. | |