SOHO MDI 2002-12-21 20:47:32 UT
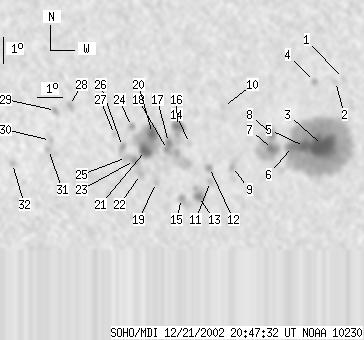
| group | Proj. U | Proj. WS | Corr. U | Corr. WS | B | L | LCM | Pos. angle | r | MU | MP |
| 132 | 883 | 66 | 446 | -8.61 | 69.85 | -5.94 | 142.41 | 0.1630 | -842.5 | -214.2 | |
|
previous
or next observation for the same group /
back to the solar disc SOHO MDI 2002-12-21 20:47:32 UT |
| spot | Proj. U | Proj. WS | Corr. U | Corr. WS | B | L | LCM | Pos. angle | r | MU | MP |
| 0 | 5 | 0 | 3 | -6.04 | 73.48 | -2.31 | 151.87 | 0.0854 | -610.0 | -534.6 | |
| 0 | 3 | 0 | 2 | -6.16 | 73.18 | -2.62 | 149.46 | 0.0898 | -591.0 | -525.6 | |
| 49 | 461 | 25 | 230 | -8.62 | 72.66 | -3.14 | 155.68 | 0.1321 | -2096.7 | -713.1 | |
| 0 | 4 | 0 | 2 | -6.16 | 72.37 | -3.43 | 142.32 | 0.0978 | 684.0 | 488.2 | |
| 13 | -3 | 6 | -3 | -8.66 | 71.96 | -3.84 | 151.22 | 0.1381 | -1702.0 | 999999 | |
| 10 | -3 | 5 | -3 | -8.66 | 71.49 | -4.30 | 148.37 | 0.1422 | -1419.9 | 999999 | |
| 8 | 72 | 4 | 36 | -8.77 | 70.71 | -5.08 | 144.44 | 0.1513 | -1455.2 | -732.3 | |
| 3 | -7 | 2 | -7 | -8.23 | 70.72 | -5.08 | 142.26 | 0.1437 | -1338.7 | 999999 | |
| 0 | 10 | 0 | 5 | -9.42 | 69.14 | -6.65 | 139.50 | 0.1768 | -949.0 | -808.1 | |
| 0 | 3 | 0 | 2 | -7.11 | 68.83 | -6.96 | 127.92 | 0.1532 | 604.0 | 482.9 | |
| 0 | 6 | 0 | 3 | -10.00 | 68.27 | -7.53 | 138.11 | 0.1942 | 771.0 | 527.0 | |
| 0 | 6 | 0 | 3 | -9.46 | 68.24 | -7.56 | 136.05 | 0.1877 | 944.0 | 710.8 | |
| 6 | 21 | 3 | 11 | -10.58 | 67.78 | -8.01 | 138.32 | 0.2070 | 1360.3 | 989.6 | |
| 0 | 4 | 0 | 2 | -8.53 | 67.48 | -8.32 | 129.63 | 0.1866 | 925.0 | 759.5 | |
| 0 | 12 | 0 | 6 | -10.65 | 67.11 | -8.69 | 136.29 | 0.2158 | 980.0 | 889.3 | |
| 7 | 103 | 4 | 52 | -7.87 | 67.02 | -8.77 | 125.33 | 0.1861 | 1242.5 | 941.8 | |
| 3 | -16 | 1 | -16 | -8.49 | 66.65 | -9.14 | 126.86 | 0.1973 | 1154.8 | 999999 | |
| 3 | -16 | 1 | -16 | -8.76 | 66.61 | -9.19 | 127.82 | 0.2007 | 1176.9 | 999999 | |
| 0 | 5 | 0 | 3 | -10.03 | 66.14 | -9.65 | 131.20 | 0.2205 | 1091.0 | 846.5 | |
| 12 | 97 | 6 | 49 | -8.14 | 66.04 | -9.76 | 123.67 | 0.2026 | -1119.6 | 173.8 | |
| 14 | -20 | 7 | -20 | -8.79 | 65.74 | -10.05 | 125.53 | 0.2129 | 1482.0 | 999999 | |
| 0 | 10 | 0 | 5 | -9.72 | 65.52 | -10.28 | 128.37 | 0.2253 | 1026.0 | 838.5 | |
| 4 | 10 | 2 | 5 | -9.17 | 65.30 | -10.50 | 125.83 | 0.2229 | 1235.7 | 951.3 | |
| 0 | 6 | 0 | 3 | -7.86 | 65.22 | -10.58 | 120.50 | 0.2120 | -948.0 | -643.1 | |
| 0 | 8 | 0 | 4 | -9.06 | 64.99 | -10.81 | 124.62 | 0.2261 | 1035.0 | 922.8 | |
| 0 | 9 | 0 | 5 | -8.63 | 64.84 | -10.95 | 122.67 | 0.2242 | -569.0 | -241.9 | |
| 0 | 4 | 0 | 2 | -8.17 | 64.54 | -11.26 | 120.20 | 0.2246 | -723.0 | -556.9 | |
| 0 | 8 | 0 | 4 | -7.04 | 62.79 | -13.00 | 112.62 | 0.2431 | 932.0 | 678.0 | |
| 0 | 5 | 0 | 3 | -7.23 | 62.23 | -13.56 | 112.51 | 0.2530 | 1220.0 | 922.0 | |
| 0 | 4 | 0 | 2 | -8.38 | 61.99 | -13.80 | 116.26 | 0.2644 | 874.0 | 626.4 | |
| 0 | 3 | 0 | 2 | -8.73 | 61.90 | -13.90 | 117.30 | 0.2683 | 1102.0 | 833.7 | |
| 0 | 4 | 0 | 2 | -9.26 | 60.43 | -15.36 | 116.76 | 0.2942 | 901.0 | 659.7 | |
| Proj. U | - Projected umbra area in millionths of solar disc, negative values indicate | |
|
that the umbra consists of fragmented regions which cannot be separated without losing umbral area. In this way several spots (intensity minima in the umbra) have a common umbra, e.g. -2 means that the given spot shares an umbra with spot No.2, and the common U value is indicated at spot No.2. |
||
| Proj. WS | - Projected whole spot area in millionths of solar disc, negative values indicate | |
|
that several umbras have a common penumbra, e.g. -7 means that the given umbra shares a penumbra with umbra No.7, and the WS value is indicated at No.7. |
||
| Corr. U | - Corrected umbra area in millionths of solar hemisphere, for negative values see above | |
| Corr. WS | - Corrected whole spot area in millionths of solar hemisphere, for negative values see above | |
| B | - Heliographic latitude B; positive: North, negative: South | |
| L | - Heliographic longitude L | |
| LCM | - Longitudinal distance from the Sun's central meridian | |
| Pos. angle | - Position angle | |
| r | - Distance from the centre of Sun's disc in terms of Sun's radius | |
| MU | - Mean magnetic field within the umbra contour averaged the pixel values with sign. | |
| MP | - Mean magnetic field within the penumbra contour averaged the pixel values with sign. | |