SOHO MDI 2002-12-21 22:23:32 UT
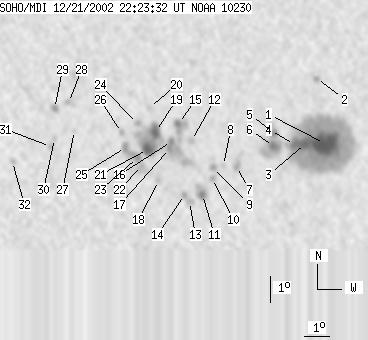
| group | Proj. U | Proj. WS | Corr. U | Corr. WS | B | L | LCM | Pos. angle | r | MU | MP |
| 122 | 880 | 62 | 443 | -8.69 | 69.76 | -5.16 | 146.96 | 0.1566 | -872.0 | -206.6 | |
|
previous
or next observation for the same group /
back to the solar disc SOHO MDI 2002-12-21 22:23:32 UT |
| spot | Proj. U | Proj. WS | Corr. U | Corr. WS | B | L | LCM | Pos. angle | r | MU | MP |
| 47 | 466 | 23 | 232 | -8.63 | 72.63 | -2.29 | 161.76 | 0.1268 | -2062.0 | -717.3 | |
| 0 | 5 | 0 | 3 | -6.13 | 72.33 | -2.58 | 149.58 | 0.0890 | 595.0 | 365.2 | |
| 10 | -1 | 5 | -1 | -8.63 | 71.89 | -3.03 | 156.46 | 0.1313 | -1752.2 | 999999 | |
| 8 | -1 | 4 | -1 | -8.67 | 71.46 | -3.45 | 153.70 | 0.1351 | -1432.2 | 999999 | |
| 4 | 65 | 2 | 32 | -8.24 | 70.69 | -4.23 | 147.20 | 0.1353 | -1320.8 | -758.5 | |
| 9 | -5 | 5 | -5 | -8.75 | 70.65 | -4.27 | 148.87 | 0.1430 | -1414.1 | 999999 | |
| 0 | 12 | 0 | 6 | -9.51 | 69.19 | -5.72 | 143.98 | 0.1680 | -1002.0 | -858.0 | |
| 0 | 3 | 0 | 2 | -9.47 | 68.69 | -6.23 | 141.50 | 0.1727 | 416.0 | 327.0 | |
| 0 | 6 | 0 | 3 | -9.55 | 68.26 | -6.66 | 139.91 | 0.1785 | 925.0 | 775.3 | |
| 0 | 6 | 0 | 3 | -9.98 | 68.25 | -6.67 | 141.39 | 0.1842 | 775.0 | 655.9 | |
| 5 | 22 | 3 | 11 | -10.59 | 67.84 | -7.07 | 141.82 | 0.1968 | 1287.3 | 934.2 | |
| 0 | 6 | 0 | 3 | -8.50 | 67.46 | -7.46 | 132.54 | 0.1751 | 1075.0 | 801.8 | |
| 0 | 6 | 0 | 3 | -10.86 | 67.32 | -7.59 | 140.72 | 0.2059 | 929.0 | 714.5 | |
| 0 | 9 | 0 | 5 | -10.59 | 67.13 | -7.78 | 139.15 | 0.2045 | 1172.0 | 812.6 | |
| 5 | 22 | 2 | 11 | -7.85 | 66.96 | -7.96 | 127.83 | 0.1744 | 1098.7 | 970.7 | |
| 3 | 71 | 2 | 36 | -8.54 | 66.67 | -8.24 | 129.89 | 0.1857 | 1117.7 | 982.9 | |
| 2 | -16 | 1 | -16 | -8.81 | 66.59 | -8.33 | 130.72 | 0.1897 | 1343.3 | 999999 | |
| 0 | 4 | 0 | 2 | -10.04 | 66.13 | -8.79 | 133.85 | 0.2097 | 989.0 | 788.7 | |
| 11 | 94 | 6 | 47 | -8.15 | 66.05 | -8.86 | 126.25 | 0.1900 | -1145.4 | 207.8 | |
| 0 | 4 | 0 | 2 | -7.23 | 65.84 | -9.08 | 121.46 | 0.1843 | -833.0 | -645.3 | |
| 10 | -19 | 5 | -19 | -8.84 | 65.72 | -9.19 | 128.12 | 0.2016 | 1549.7 | 999999 | |
| 0 | 15 | 0 | 8 | -9.46 | 65.47 | -9.44 | 129.74 | 0.2115 | 1040.0 | 802.4 | |
| 2 | 27 | 1 | 14 | -9.15 | 65.32 | -9.59 | 128.14 | 0.2102 | 1371.1 | 706.9 | |
| 0 | 6 | 0 | 3 | -7.84 | 65.36 | -9.56 | 122.91 | 0.1969 | -851.0 | -581.9 | |
| 4 | -23 | 2 | -23 | -8.76 | 64.86 | -10.06 | 125.38 | 0.2126 | -110.8 | 999999 | |
| 0 | 4 | 0 | 2 | -8.18 | 64.72 | -10.20 | 122.70 | 0.2092 | -1056.0 | -734.7 | |
| 0 | 3 | 0 | 2 | -8.09 | 62.87 | -12.05 | 118.27 | 0.2358 | 577.0 | 441.6 | |
| 0 | 6 | 0 | 3 | -7.02 | 62.66 | -12.26 | 113.69 | 0.2311 | 853.0 | 664.6 | |
| 2 | 7 | 1 | 4 | -7.24 | 62.10 | -12.82 | 113.67 | 0.2414 | 1164.8 | 828.1 | |
| 0 | 3 | 0 | 2 | -8.40 | 62.06 | -12.85 | 117.90 | 0.2501 | 712.0 | 585.9 | |
| 0 | 4 | 0 | 2 | -8.71 | 61.89 | -13.02 | 118.69 | 0.2551 | 795.0 | 756.3 | |
| 0 | 4 | 0 | 2 | -9.27 | 60.35 | -14.56 | 117.99 | 0.2823 | 869.0 | 646.7 | |
| Proj. U | - Projected umbra area in millionths of solar disc, negative values indicate | |
|
that the umbra consists of fragmented regions which cannot be separated without losing umbral area. In this way several spots (intensity minima in the umbra) have a common umbra, e.g. -2 means that the given spot shares an umbra with spot No.2, and the common U value is indicated at spot No.2. |
||
| Proj. WS | - Projected whole spot area in millionths of solar disc, negative values indicate | |
|
that several umbras have a common penumbra, e.g. -7 means that the given umbra shares a penumbra with umbra No.7, and the WS value is indicated at No.7. |
||
| Corr. U | - Corrected umbra area in millionths of solar hemisphere, for negative values see above | |
| Corr. WS | - Corrected whole spot area in millionths of solar hemisphere, for negative values see above | |
| B | - Heliographic latitude B; positive: North, negative: South | |
| L | - Heliographic longitude L | |
| LCM | - Longitudinal distance from the Sun's central meridian | |
| Pos. angle | - Position angle | |
| r | - Distance from the centre of Sun's disc in terms of Sun's radius | |
| MU | - Mean magnetic field within the umbra contour averaged the pixel values with sign. | |
| MP | - Mean magnetic field within the penumbra contour averaged the pixel values with sign. | |