SOHO MDI 2002-12-21 23:59:32 UT
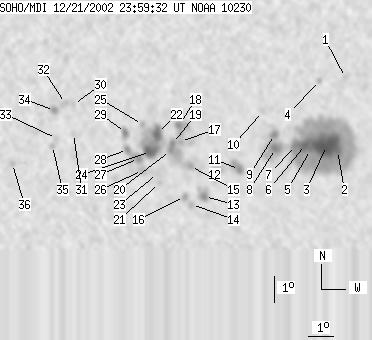
| group | Proj. U | Proj. WS | Corr. U | Corr. WS | B | L | LCM | Pos. angle | r | MU | MP |
| 140 | 904 | 71 | 454 | -8.68 | 69.70 | -4.34 | 151.86 | 0.1498 | -866.3 | -201.7 | |
|
previous
or next observation for the same group /
back to the solar disc SOHO MDI 2002-12-21 23:59:32 UT |
| spot | Proj. U | Proj. WS | Corr. U | Corr. WS | B | L | LCM | Pos. angle | r | MU | MP |
| 0 | 6 | 0 | 3 | -6.02 | 73.39 | -0.65 | 171.34 | 0.0756 | -629.0 | -547.8 | |
| 5 | 463 | 3 | 231 | -8.83 | 73.07 | -0.97 | 172.29 | 0.1249 | -1548.9 | -691.5 | |
| 47 | -2 | 23 | -2 | -8.64 | 72.64 | -1.39 | 168.66 | 0.1228 | -2088.1 | 999999 | |
| 0 | 5 | 0 | 2 | -6.14 | 72.38 | -1.65 | 159.40 | 0.0820 | 793.0 | 426.7 | |
| 3 | -2 | 1 | -2 | -8.80 | 72.02 | -2.01 | 164.18 | 0.1279 | -1366.7 | 999999 | |
| 12 | -2 | 6 | -2 | -8.60 | 71.83 | -2.21 | 162.28 | 0.1257 | -1739.0 | 999999 | |
| 7 | -2 | 4 | -2 | -8.64 | 71.44 | -2.59 | 159.52 | 0.1285 | -1314.6 | 999999 | |
| 8 | 63 | 4 | 32 | -8.76 | 70.67 | -3.37 | 154.50 | 0.1356 | -1430.6 | -764.6 | |
| 4 | -8 | 2 | -8 | -8.21 | 70.63 | -3.41 | 152.40 | 0.1275 | -1233.9 | 999999 | |
| 0 | 4 | 0 | 2 | -7.33 | 70.17 | -3.86 | 145.47 | 0.1184 | -792.0 | -605.7 | |
| 3 | 20 | 2 | 10 | -9.56 | 69.26 | -4.78 | 148.83 | 0.1596 | -1038.1 | -626.6 | |
| 0 | 9 | 0 | 4 | -9.60 | 68.36 | -5.68 | 144.45 | 0.1686 | 1020.0 | 710.5 | |
| 4 | 20 | 2 | 10 | -10.60 | 67.87 | -6.17 | 145.55 | 0.1876 | 1311.0 | 902.7 | |
| 0 | 5 | 0 | 3 | -10.91 | 67.35 | -6.68 | 144.34 | 0.1970 | 1065.0 | 833.8 | |
| 0 | 13 | 0 | 7 | -9.44 | 67.35 | -6.69 | 139.35 | 0.1773 | 1047.0 | 977.9 | |
| 0 | 8 | 0 | 4 | -10.60 | 67.09 | -6.95 | 142.30 | 0.1955 | 1121.0 | 718.6 | |
| 0 | 21 | 0 | 10 | -8.47 | 66.97 | -7.06 | 133.93 | 0.1697 | 1160.0 | 893.2 | |
| 4 | 22 | 2 | 11 | -7.86 | 66.91 | -7.13 | 130.88 | 0.1634 | 1093.6 | 920.4 | |
| 3 | 44 | 2 | 22 | -8.55 | 66.66 | -7.38 | 133.02 | 0.1745 | 1025.7 | 1022.3 | |
| 3 | -19 | 1 | -19 | -8.82 | 66.58 | -7.46 | 133.83 | 0.1787 | 1239.0 | 999999 | |
| 0 | 3 | 0 | 2 | -10.06 | 66.12 | -7.92 | 136.82 | 0.1992 | 981.0 | 774.4 | |
| 12 | 92 | 6 | 47 | -8.16 | 66.08 | -7.96 | 129.22 | 0.1777 | -953.1 | 178.5 | |
| 0 | 10 | 0 | 5 | -9.71 | 66.05 | -7.99 | 135.32 | 0.1958 | 724.0 | 673.2 | |
| 12 | -22 | 6 | -22 | -8.86 | 65.79 | -8.25 | 131.15 | 0.1891 | 1499.8 | 999999 | |
| 0 | 6 | 0 | 3 | -7.81 | 65.50 | -8.54 | 125.73 | 0.1820 | -631.0 | -515.8 | |
| 0 | 9 | 0 | 5 | -9.59 | 65.46 | -8.58 | 132.88 | 0.2016 | 887.0 | 846.9 | |
| 3 | 32 | 2 | 16 | -9.12 | 65.31 | -8.72 | 130.64 | 0.1983 | 1399.1 | 657.7 | |
| 3 | -27 | 2 | -27 | -8.77 | 64.89 | -9.15 | 127.95 | 0.2002 | -184.4 | 999999 | |
| 4 | 11 | 2 | 6 | -8.12 | 64.83 | -9.21 | 125.05 | 0.1944 | -990.1 | -639.0 | |
| 0 | 4 | 0 | 2 | -7.03 | 62.81 | -11.22 | 115.57 | 0.2152 | 789.0 | 523.7 | |
| 0 | 4 | 0 | 2 | -8.15 | 62.78 | -11.25 | 120.06 | 0.2243 | 672.0 | 507.2 | |
| 0 | 8 | 0 | 4 | -6.99 | 62.50 | -11.54 | 114.81 | 0.2198 | 746.0 | 613.0 | |
| 0 | 3 | 0 | 1 | -8.33 | 62.11 | -11.93 | 119.38 | 0.2359 | 559.0 | 531.0 | |
| 3 | 10 | 1 | 5 | -7.26 | 62.06 | -11.98 | 115.10 | 0.2284 | 1239.8 | 830.8 | |
| 0 | 4 | 0 | 2 | -8.60 | 61.94 | -12.10 | 120.04 | 0.2405 | 1067.0 | 730.1 | |
| 0 | 5 | 0 | 3 | -9.29 | 60.32 | -13.72 | 119.41 | 0.2699 | 926.0 | 635.9 | |
| Proj. U | - Projected umbra area in millionths of solar disc, negative values indicate | |
|
that the umbra consists of fragmented regions which cannot be separated without losing umbral area. In this way several spots (intensity minima in the umbra) have a common umbra, e.g. -2 means that the given spot shares an umbra with spot No.2, and the common U value is indicated at spot No.2. |
||
| Proj. WS | - Projected whole spot area in millionths of solar disc, negative values indicate | |
|
that several umbras have a common penumbra, e.g. -7 means that the given umbra shares a penumbra with umbra No.7, and the WS value is indicated at No.7. |
||
| Corr. U | - Corrected umbra area in millionths of solar hemisphere, for negative values see above | |
| Corr. WS | - Corrected whole spot area in millionths of solar hemisphere, for negative values see above | |
| B | - Heliographic latitude B; positive: North, negative: South | |
| L | - Heliographic longitude L | |
| LCM | - Longitudinal distance from the Sun's central meridian | |
| Pos. angle | - Position angle | |
| r | - Distance from the centre of Sun's disc in terms of Sun's radius | |
| MU | - Mean magnetic field within the umbra contour averaged the pixel values with sign. | |
| MP | - Mean magnetic field within the penumbra contour averaged the pixel values with sign. | |