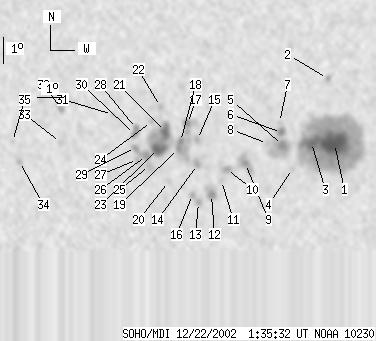
SOHO MDI 2002-12-22 01:35:32 UT
| group | Proj. U | Proj. WS | Corr. U | Corr. WS | B | L | LCM | Pos. angle | r | MU | MP |
| 145 | 839 | 72 | 424 | -8.74 | 69.89 | -3.27 | 158.57 | 0.1424 | -899.4 | -239.2 | |
|
previous
or next observation for the same group /
back to the solar disc SOHO MDI 2002-12-22 01:35:32 UT |
| spot | Proj. U | Proj. WS | Corr. U | Corr. WS | B | L | LCM | Pos. angle | r | MU | MP |
| 55 | 460 | 27 | 230 | -8.65 | 72.65 | -0.51 | 175.81 | 0.1207 | -2051.5 | -656.7 | |
| 0 | 5 | 0 | 2 | -6.15 | 72.38 | -0.78 | 170.01 | 0.0779 | 764.0 | 457.7 | |
| 25 | -1 | 13 | -1 | -8.61 | 71.76 | -1.40 | 168.55 | 0.1222 | -1585.8 | 999999 | |
| 0 | 3 | 0 | 2 | -9.61 | 71.02 | -2.14 | 164.90 | 0.1421 | -609.0 | -448.7 | |
| 7 | 39 | 4 | 20 | -8.73 | 70.63 | -2.52 | 160.24 | 0.1294 | -1409.1 | -663.0 | |
| 4 | 10 | 2 | 5 | -8.22 | 70.60 | -2.56 | 158.55 | 0.1214 | -1193.7 | -990.7 | |
| 0 | 4 | 0 | 2 | -7.84 | 70.52 | -2.63 | 156.71 | 0.1157 | -849.0 | -693.0 | |
| 0 | 3 | 0 | 2 | -8.65 | 70.05 | -3.11 | 155.92 | 0.1319 | -380.0 | -407.7 | |
| 3 | 27 | 1 | 13 | -9.42 | 69.19 | -3.97 | 152.86 | 0.1504 | -901.5 | -627.8 | |
| 0 | 12 | 0 | 6 | -9.65 | 68.45 | -4.71 | 149.45 | 0.1601 | 968.0 | 708.6 | |
| 0 | 4 | 0 | 2 | -10.07 | 68.25 | -4.91 | 149.75 | 0.1682 | 785.0 | 670.6 | |
| 5 | 20 | 2 | 10 | -10.62 | 67.85 | -5.31 | 149.41 | 0.1797 | 1213.2 | 879.4 | |
| 0 | 7 | 0 | 4 | -10.92 | 67.33 | -5.83 | 147.96 | 0.1888 | 1037.0 | 735.5 | |
| 0 | 10 | 0 | 5 | -9.45 | 67.32 | -5.84 | 143.14 | 0.1681 | 1318.0 | 1074.8 | |
| 0 | 5 | 0 | 3 | -8.49 | 67.33 | -5.82 | 139.42 | 0.1550 | 1141.0 | 990.4 | |
| 0 | 7 | 0 | 4 | -10.61 | 67.10 | -6.06 | 146.03 | 0.1865 | 981.0 | 705.8 | |
| 4 | 15 | 2 | 8 | -7.87 | 66.95 | -6.20 | 134.84 | 0.1517 | 1080.4 | 859.3 | |
| 3 | 34 | 2 | 17 | -8.56 | 66.67 | -6.49 | 136.68 | 0.1636 | 1045.7 | 1123.3 | |
| 2 | -18 | 1 | -18 | -8.83 | 66.59 | -6.57 | 137.45 | 0.1680 | 1355.9 | 999999 | |
| 0 | 5 | 0 | 3 | -10.11 | 66.17 | -6.99 | 140.49 | 0.1891 | 967.0 | 788.3 | |
| 13 | 88 | 6 | 44 | -8.17 | 66.09 | -7.07 | 132.56 | 0.1661 | -1026.6 | 159.4 | |
| 0 | 4 | 0 | 2 | -7.21 | 65.91 | -7.24 | 127.24 | 0.1579 | -796.0 | -713.8 | |
| 16 | -21 | 8 | -21 | -8.83 | 65.81 | -7.35 | 134.25 | 0.1774 | 1455.9 | 999999 | |
| 0 | 3 | 0 | 2 | -7.79 | 65.55 | -7.61 | 128.72 | 0.1689 | -670.0 | -518.2 | |
| 0 | 12 | 0 | 6 | -9.48 | 65.44 | -7.72 | 135.45 | 0.1897 | 1027.0 | 850.6 | |
| 3 | 9 | 2 | 4 | -9.10 | 65.33 | -7.83 | 133.56 | 0.1864 | 1397.0 | 1123.1 | |
| 0 | 6 | 0 | 3 | -9.25 | 64.98 | -8.18 | 132.90 | 0.1927 | 906.0 | 669.3 | |
| 2 | 14 | 1 | 7 | -8.05 | 64.96 | -8.20 | 127.88 | 0.1797 | -1051.4 | -609.1 | |
| 0 | 7 | 0 | 4 | -8.79 | 64.91 | -8.25 | 130.82 | 0.1883 | -99.0 | 101.9 | |
| 3 | -28 | 1 | -28 | -8.29 | 64.88 | -8.28 | 128.62 | 0.1832 | -970.6 | 999999 | |
| 0 | 3 | 0 | 2 | -7.51 | 64.04 | -9.12 | 122.58 | 0.1874 | 518.0 | 344.5 | |
| 0 | 8 | 0 | 4 | -7.27 | 62.04 | -11.12 | 116.75 | 0.2152 | 1283.0 | 973.7 | |
| 0 | 5 | 0 | 3 | -8.58 | 61.96 | -11.20 | 121.83 | 0.2270 | 685.0 | 593.0 | |
| 0 | 5 | 0 | 3 | -9.30 | 60.31 | -12.85 | 121.01 | 0.2572 | 874.0 | 618.1 | |
| 0 | 5 | 0 | 2 | -8.53 | 60.06 | -13.10 | 117.87 | 0.2547 | 651.0 | 425.2 | |
| Proj. U | - Projected umbra area in millionths of solar disc, negative values indicate | |
|
that the umbra consists of fragmented regions which cannot be separated without losing umbral area. In this way several spots (intensity minima in the umbra) have a common umbra, e.g. -2 means that the given spot shares an umbra with spot No.2, and the common U value is indicated at spot No.2. |
||
| Proj. WS | - Projected whole spot area in millionths of solar disc, negative values indicate | |
|
that several umbras have a common penumbra, e.g. -7 means that the given umbra shares a penumbra with umbra No.7, and the WS value is indicated at No.7. |
||
| Corr. U | - Corrected umbra area in millionths of solar hemisphere, for negative values see above | |
| Corr. WS | - Corrected whole spot area in millionths of solar hemisphere, for negative values see above | |
| B | - Heliographic latitude B; positive: North, negative: South | |
| L | - Heliographic longitude L | |
| LCM | - Longitudinal distance from the Sun's central meridian | |
| Pos. angle | - Position angle | |
| r | - Distance from the centre of Sun's disc in terms of Sun's radius | |
| MU | - Mean magnetic field within the umbra contour averaged the pixel values with sign. | |
| MP | - Mean magnetic field within the penumbra contour averaged the pixel values with sign. | |