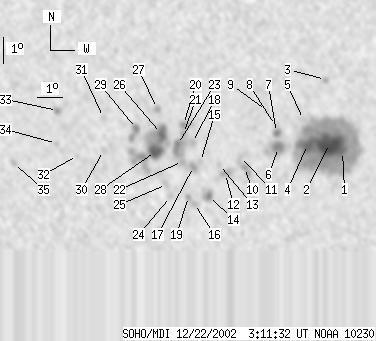
SOHO MDI 2002-12-22 03:11:32 UT
| group | Proj. U | Proj. WS | Corr. U | Corr. WS | B | L | LCM | Pos. angle | r | MU | MP |
| 128 | 878 | 65 | 440 | -8.68 | 69.86 | -2.42 | 163.96 | 0.1369 | -1058.3 | -232.3 | |
|
previous
or next observation for the same group /
back to the solar disc SOHO MDI 2002-12-22 03:11:32 UT |
| spot | Proj. U | Proj. WS | Corr. U | Corr. WS | B | L | LCM | Pos. angle | r | MU | MP |
| 7 | 468 | 3 | 233 | -8.89 | 73.09 | 0.81 | 186.46 | 0.1253 | -1492.5 | -674.1 | |
| 49 | -1 | 25 | -1 | -8.58 | 72.59 | 0.31 | 182.57 | 0.1192 | -2083.2 | 999999 | |
| 0 | 6 | 0 | 3 | -6.12 | 72.43 | 0.15 | 182.01 | 0.0761 | 693.0 | 444.0 | |
| 23 | -1 | 11 | -1 | -8.62 | 71.74 | -0.54 | 175.50 | 0.1201 | -1593.2 | 999999 | |
| 0 | 4 | 0 | 2 | -7.66 | 71.58 | -0.70 | 173.29 | 0.1037 | -231.0 | -307.2 | |
| 10 | 42 | 5 | 21 | -8.74 | 70.61 | -1.67 | 166.65 | 0.1252 | -1405.6 | -726.5 | |
| 3 | 11 | 2 | 5 | -8.16 | 70.54 | -1.74 | 164.85 | 0.1157 | -1263.5 | -893.2 | |
| 0 | 2 | 0 | 1 | -7.89 | 70.50 | -1.78 | 163.88 | 0.1114 | -873.0 | -808.1 | |
| 0 | 3 | 0 | 1 | -7.31 | 70.15 | -2.13 | 159.12 | 0.1037 | -747.0 | -606.4 | |
| 0 | 11 | 0 | 6 | -9.51 | 69.29 | -2.99 | 159.06 | 0.1448 | -980.0 | -825.1 | |
| 0 | 8 | 0 | 4 | -9.08 | 69.14 | -3.15 | 156.93 | 0.1389 | -675.0 | -708.1 | |
| 0 | 10 | 0 | 5 | -9.74 | 68.54 | -3.74 | 155.14 | 0.1535 | 935.0 | 685.1 | |
| 0 | 4 | 0 | 2 | -9.39 | 68.32 | -3.96 | 152.77 | 0.1498 | 294.0 | 272.0 | |
| 4 | 17 | 2 | 9 | -10.63 | 67.87 | -4.41 | 153.86 | 0.1723 | 1240.1 | 919.5 | |
| 0 | 5 | 0 | 3 | -9.27 | 67.58 | -4.70 | 148.21 | 0.1543 | 781.0 | 677.3 | |
| 0 | 4 | 0 | 2 | -10.90 | 67.32 | -4.96 | 151.84 | 0.1808 | 1018.0 | 819.9 | |
| 0 | 17 | 0 | 9 | -9.46 | 67.30 | -4.98 | 147.41 | 0.1597 | 1323.0 | 920.6 | |
| 0 | 6 | 0 | 3 | -8.54 | 67.28 | -5.00 | 143.80 | 0.1467 | 1109.0 | 916.9 | |
| 0 | 4 | 0 | 2 | -10.63 | 67.09 | -5.19 | 149.98 | 0.1786 | 985.0 | 713.3 | |
| 0 | 16 | 0 | 8 | -7.84 | 66.93 | -5.35 | 138.91 | 0.1411 | 1156.0 | 793.1 | |
| 0 | 5 | 0 | 3 | -8.19 | 66.93 | -5.35 | 140.47 | 0.1457 | 968.0 | 794.5 | |
| 0 | 9 | 0 | 4 | -9.27 | 66.88 | -5.40 | 144.55 | 0.1610 | 1197.0 | 945.3 | |
| 4 | 26 | 2 | 13 | -8.61 | 66.69 | -5.59 | 141.06 | 0.1540 | 1171.4 | 1157.1 | |
| 0 | 6 | 0 | 3 | -10.62 | 66.38 | -5.90 | 146.74 | 0.1850 | 761.0 | 539.8 | |
| 0 | 8 | 0 | 4 | -10.16 | 66.24 | -6.04 | 144.62 | 0.1799 | 822.0 | 756.6 | |
| 11 | 133 | 6 | 67 | -8.19 | 66.07 | -6.21 | 136.27 | 0.1555 | -989.7 | 388.2 | |
| 0 | 6 | 0 | 3 | -7.22 | 65.93 | -6.35 | 130.94 | 0.1459 | -966.0 | -812.3 | |
| 14 | -26 | 7 | -26 | -8.88 | 65.83 | -6.45 | 138.13 | 0.1671 | 1482.0 | 999999 | |
| 3 | 21 | 2 | 10 | -7.99 | 65.10 | -7.18 | 131.25 | 0.1653 | -921.5 | -668.1 | |
| 0 | 5 | 0 | 3 | -8.83 | 63.80 | -8.48 | 130.20 | 0.1918 | -651.0 | -436.6 | |
| 0 | 3 | 0 | 2 | -7.56 | 63.82 | -8.46 | 124.75 | 0.1783 | 551.0 | 434.4 | |
| 0 | 3 | 0 | 1 | -9.02 | 62.77 | -9.51 | 127.80 | 0.2075 | 653.0 | 612.9 | |
| 0 | 6 | 0 | 3 | -7.28 | 62.03 | -10.25 | 118.65 | 0.2021 | 1148.0 | 855.3 | |
| 0 | 4 | 0 | 2 | -8.55 | 61.96 | -10.32 | 123.78 | 0.2142 | 657.0 | 457.1 | |
| 0 | 5 | 0 | 3 | -9.32 | 60.23 | -12.05 | 122.64 | 0.2457 | 782.0 | 646.2 | |
| Proj. U | - Projected umbra area in millionths of solar disc, negative values indicate | |
|
that the umbra consists of fragmented regions which cannot be separated without losing umbral area. In this way several spots (intensity minima in the umbra) have a common umbra, e.g. -2 means that the given spot shares an umbra with spot No.2, and the common U value is indicated at spot No.2. |
||
| Proj. WS | - Projected whole spot area in millionths of solar disc, negative values indicate | |
|
that several umbras have a common penumbra, e.g. -7 means that the given umbra shares a penumbra with umbra No.7, and the WS value is indicated at No.7. |
||
| Corr. U | - Corrected umbra area in millionths of solar hemisphere, for negative values see above | |
| Corr. WS | - Corrected whole spot area in millionths of solar hemisphere, for negative values see above | |
| B | - Heliographic latitude B; positive: North, negative: South | |
| L | - Heliographic longitude L | |
| LCM | - Longitudinal distance from the Sun's central meridian | |
| Pos. angle | - Position angle | |
| r | - Distance from the centre of Sun's disc in terms of Sun's radius | |
| MU | - Mean magnetic field within the umbra contour averaged the pixel values with sign. | |
| MP | - Mean magnetic field within the penumbra contour averaged the pixel values with sign. | |