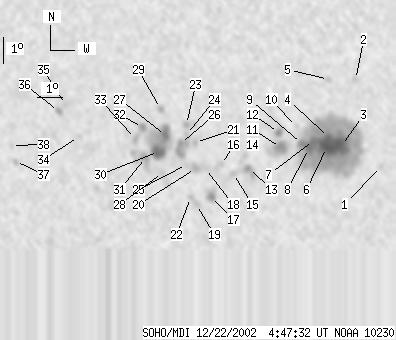
SOHO MDI 2002-12-22 04:47:32 UT
| group | Proj. U | Proj. WS | Corr. U | Corr. WS | B | L | LCM | Pos. angle | r | MU | MP |
| 118 | 861 | 60 | 432 | -8.75 | 69.87 | -1.53 | 170.46 | 0.1352 | -1021.0 | -281.6 | |
|
previous
or next observation for the same group /
back to the solar disc SOHO MDI 2002-12-22 04:47:32 UT |
| spot | Proj. U | Proj. WS | Corr. U | Corr. WS | B | L | LCM | Pos. angle | r | MU | MP |
| 0 | 4 | 0 | 2 | -9.47 | 74.47 | 3.07 | 201.51 | 0.1446 | 281.0 | 163.7 | |
| 0 | 5 | 0 | 2 | -6.12 | 73.48 | 2.08 | 205.47 | 0.0842 | -577.0 | -589.1 | |
| 25 | 460 | 13 | 230 | -8.67 | 72.95 | 1.55 | 192.56 | 0.1233 | -1810.6 | -702.9 | |
| 6 | -3 | 3 | -3 | -8.36 | 72.44 | 1.04 | 188.94 | 0.1164 | -1883.5 | 999999 | |
| 0 | 5 | 0 | 2 | -6.13 | 72.44 | 1.04 | 193.38 | 0.0782 | 577.0 | 449.7 | |
| 27 | -3 | 13 | -3 | -8.74 | 72.37 | 0.97 | 187.83 | 0.1229 | -2093.7 | 999999 | |
| 6 | -3 | 3 | -3 | -8.47 | 71.86 | 0.46 | 183.92 | 0.1173 | -1754.2 | 999999 | |
| 5 | -3 | 3 | -3 | -8.78 | 71.67 | 0.27 | 182.18 | 0.1225 | -1551.8 | 999999 | |
| 4 | -3 | 2 | -3 | -8.59 | 71.40 | -0.00 | 179.98 | 0.1191 | -1336.0 | 999999 | |
| 0 | 2 | 0 | 1 | -7.93 | 71.21 | -0.20 | 178.19 | 0.1077 | -595.0 | -531.9 | |
| 9 | 31 | 5 | 15 | -8.74 | 70.58 | -0.82 | 173.37 | 0.1226 | -1391.7 | -829.1 | |
| 3 | 13 | 2 | 7 | -8.16 | 70.51 | -0.89 | 172.10 | 0.1127 | -1217.2 | -845.4 | |
| 2 | 16 | 1 | 8 | -9.55 | 69.34 | -2.06 | 165.29 | 0.1405 | -883.1 | -639.0 | |
| 0 | 10 | 0 | 5 | -9.05 | 69.19 | -2.21 | 163.22 | 0.1328 | -707.0 | -593.6 | |
| 0 | 5 | 0 | 3 | -9.75 | 68.75 | -2.65 | 161.81 | 0.1465 | 820.0 | 660.3 | |
| 0 | 11 | 0 | 5 | -9.40 | 68.29 | -3.11 | 158.00 | 0.1436 | 314.0 | 207.3 | |
| 4 | 14 | 2 | 7 | -10.64 | 67.89 | -3.51 | 158.63 | 0.1661 | 1133.9 | 912.9 | |
| 0 | 8 | 0 | 4 | -9.55 | 67.67 | -3.73 | 154.59 | 0.1504 | 806.0 | 666.9 | |
| 0 | 4 | 0 | 2 | -10.94 | 67.30 | -4.10 | 156.20 | 0.1749 | 884.0 | 760.2 | |
| 0 | 11 | 0 | 6 | -9.55 | 67.28 | -4.12 | 152.32 | 0.1534 | 1344.0 | 1011.9 | |
| 0 | 4 | 0 | 2 | -8.55 | 67.29 | -4.11 | 148.95 | 0.1382 | 1134.0 | 943.8 | |
| 0 | 4 | 0 | 2 | -10.67 | 67.07 | -4.33 | 154.34 | 0.1723 | 744.0 | 673.3 | |
| 0 | 5 | 0 | 3 | -7.85 | 66.95 | -4.45 | 143.97 | 0.1314 | 1214.0 | 897.6 | |
| 0 | 6 | 0 | 3 | -8.24 | 66.94 | -4.46 | 145.63 | 0.1369 | 834.0 | 652.6 | |
| 0 | 3 | 0 | 2 | -9.39 | 66.93 | -4.47 | 149.86 | 0.1540 | 1025.0 | 951.1 | |
| 2 | 28 | 1 | 14 | -8.58 | 66.71 | -4.70 | 145.66 | 0.1442 | 1268.5 | 1162.5 | |
| 6 | 104 | 3 | 52 | -8.27 | 66.13 | -5.28 | 141.20 | 0.1459 | -1018.4 | 10.0 | |
| 0 | 23 | 0 | 12 | -9.70 | 65.99 | -5.41 | 146.00 | 0.1671 | 908.0 | 678.1 | |
| 0 | 5 | 0 | 3 | -7.23 | 65.95 | -5.46 | 135.23 | 0.1346 | -974.0 | -854.1 | |
| 16 | -27 | 8 | -27 | -8.89 | 65.85 | -5.56 | 142.32 | 0.1572 | 1391.1 | 999999 | |
| 0 | 40 | 0 | 20 | -9.12 | 65.33 | -6.07 | 140.78 | 0.1658 | 1409.0 | 769.3 | |
| 3 | 11 | 1 | 6 | -7.96 | 65.24 | -6.17 | 135.38 | 0.1522 | -1021.4 | -708.7 | |
| 0 | 8 | 0 | 4 | -8.39 | 64.96 | -6.44 | 136.04 | 0.1607 | -828.0 | -602.4 | |
| 0 | 4 | 0 | 2 | -8.30 | 62.73 | -8.67 | 127.35 | 0.1885 | 472.0 | 385.3 | |
| 0 | 4 | 0 | 2 | -7.06 | 62.25 | -9.15 | 120.35 | 0.1838 | 772.0 | 636.3 | |
| 0 | 6 | 0 | 3 | -7.33 | 61.97 | -9.43 | 120.86 | 0.1902 | 977.0 | 793.5 | |
| 0 | 4 | 0 | 2 | -9.25 | 60.23 | -11.17 | 124.31 | 0.2327 | 975.0 | 685.2 | |
| 0 | 3 | 0 | 1 | -8.63 | 60.09 | -11.31 | 121.71 | 0.2291 | 802.0 | 598.4 | |
| Proj. U | - Projected umbra area in millionths of solar disc, negative values indicate | |
|
that the umbra consists of fragmented regions which cannot be separated without losing umbral area. In this way several spots (intensity minima in the umbra) have a common umbra, e.g. -2 means that the given spot shares an umbra with spot No.2, and the common U value is indicated at spot No.2. |
||
| Proj. WS | - Projected whole spot area in millionths of solar disc, negative values indicate | |
|
that several umbras have a common penumbra, e.g. -7 means that the given umbra shares a penumbra with umbra No.7, and the WS value is indicated at No.7. |
||
| Corr. U | - Corrected umbra area in millionths of solar hemisphere, for negative values see above | |
| Corr. WS | - Corrected whole spot area in millionths of solar hemisphere, for negative values see above | |
| B | - Heliographic latitude B; positive: North, negative: South | |
| L | - Heliographic longitude L | |
| LCM | - Longitudinal distance from the Sun's central meridian | |
| Pos. angle | - Position angle | |
| r | - Distance from the centre of Sun's disc in terms of Sun's radius | |
| MU | - Mean magnetic field within the umbra contour averaged the pixel values with sign. | |
| MP | - Mean magnetic field within the penumbra contour averaged the pixel values with sign. | |