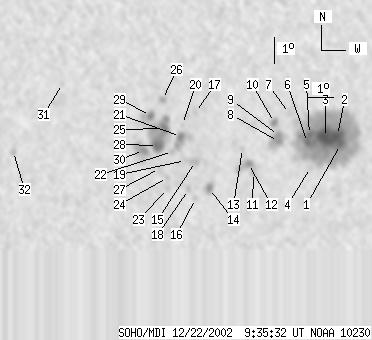
SOHO MDI 2002-12-22 09:35:32 UT
| group | Proj. U | Proj. WS | Corr. U | Corr. WS | B | L | LCM | Pos. angle | r | MU | MP |
| 111 | 770 | 54 | 383 | -8.82 | 70.16 | 1.39 | 190.55 | 0.1356 | -931.2 | -381.3 | |
|
previous
or next observation for the same group /
back to the solar disc SOHO MDI 2002-12-22 09:35:32 UT |
| spot | Proj. U | Proj. WS | Corr. U | Corr. WS | B | L | LCM | Pos. angle | r | MU | MP |
| 9 | 443 | 4 | 221 | -8.95 | 72.99 | 4.23 | 210.32 | 0.1449 | -1492.0 | -746.7 | |
| 14 | -1 | 7 | -1 | -8.61 | 72.87 | 4.11 | 210.86 | 0.1387 | -1956.8 | 999999 | |
| 26 | -1 | 13 | -1 | -8.69 | 72.41 | 3.64 | 207.65 | 0.1359 | -2145.8 | 999999 | |
| 0 | 3 | 0 | 1 | -9.85 | 71.83 | 3.07 | 200.66 | 0.1502 | -361.0 | -283.4 | |
| 7 | -1 | 4 | -1 | -8.57 | 71.78 | 3.02 | 203.85 | 0.1294 | -1855.8 | 999999 | |
| 5 | -1 | 2 | -1 | -8.88 | 71.71 | 2.94 | 202.39 | 0.1338 | -1521.1 | 999999 | |
| 0 | 3 | 0 | 2 | -7.76 | 71.00 | 2.24 | 200.45 | 0.1113 | -680.0 | -511.8 | |
| 3 | 33 | 2 | 16 | -8.84 | 70.58 | 1.82 | 194.35 | 0.1270 | -1349.2 | -879.3 | |
| 3 | -8 | 1 | -8 | -8.61 | 70.58 | 1.82 | 194.82 | 0.1231 | -1464.9 | 999999 | |
| 4 | 9 | 2 | 5 | -8.11 | 70.42 | 1.66 | 194.64 | 0.1140 | -1173.9 | -795.7 | |
| 0 | 4 | 0 | 2 | -10.04 | 69.62 | 0.85 | 185.83 | 0.1446 | -895.0 | -719.5 | |
| 3 | 21 | 2 | 10 | -9.69 | 69.42 | 0.66 | 184.70 | 0.1383 | -767.5 | -18.2 | |
| 0 | 4 | 0 | 2 | -9.11 | 69.19 | 0.42 | 183.27 | 0.1280 | -699.0 | -625.8 | |
| 4 | 17 | 2 | 8 | -10.66 | 67.90 | -0.86 | 174.51 | 0.1553 | 1227.0 | 791.8 | |
| 0 | 9 | 0 | 4 | -9.62 | 67.36 | -1.40 | 169.92 | 0.1386 | 1128.0 | 935.6 | |
| 0 | 4 | 0 | 2 | -11.05 | 67.36 | -1.41 | 171.45 | 0.1632 | 724.0 | 593.6 | |
| 0 | 5 | 0 | 2 | -7.73 | 67.37 | -1.40 | 166.82 | 0.1064 | 656.0 | 527.6 | |
| 0 | 3 | 0 | 2 | -10.70 | 67.08 | -1.68 | 169.43 | 0.1580 | 668.0 | 500.6 | |
| 0 | 5 | 0 | 2 | -9.58 | 66.97 | -1.79 | 167.15 | 0.1393 | 922.0 | 839.8 | |
| 0 | 3 | 0 | 1 | -8.19 | 66.86 | -1.90 | 163.53 | 0.1164 | 524.0 | 507.0 | |
| 5 | 28 | 2 | 14 | -8.65 | 66.78 | -1.98 | 163.99 | 0.1245 | 1361.6 | 1041.6 | |
| 0 | 4 | 0 | 2 | -9.23 | 66.47 | -2.30 | 162.98 | 0.1357 | 922.0 | 847.8 | |
| 0 | 4 | 0 | 2 | -10.66 | 66.27 | -2.50 | 164.43 | 0.1605 | 725.0 | 538.9 | |
| 0 | 4 | 0 | 2 | -10.23 | 66.27 | -2.50 | 163.69 | 0.1534 | 851.0 | 690.5 | |
| 7 | 89 | 3 | 44 | -8.34 | 66.17 | -2.60 | 158.48 | 0.1229 | -894.8 | 5.6 | |
| 0 | 5 | 0 | 3 | -7.22 | 66.10 | -2.67 | 153.92 | 0.1056 | -1051.0 | -806.1 | |
| 0 | 10 | 0 | 5 | -9.89 | 65.96 | -2.81 | 161.06 | 0.1493 | 814.0 | 709.4 | |
| 13 | -25 | 6 | -25 | -9.00 | 65.89 | -2.88 | 158.40 | 0.1352 | 1459.2 | 999999 | |
| 4 | 22 | 2 | 11 | -7.84 | 65.63 | -3.14 | 152.70 | 0.1188 | -1239.2 | -873.9 | |
| 4 | 29 | 2 | 15 | -9.19 | 65.34 | -3.42 | 155.37 | 0.1420 | 1378.1 | 823.7 | |
| 0 | 4 | 0 | 2 | -6.60 | 62.23 | -6.54 | 126.51 | 0.1414 | 702.0 | 557.3 | |
| 0 | 5 | 0 | 3 | -9.21 | 60.27 | -8.50 | 131.53 | 0.1957 | 518.0 | 576.4 | |
| Proj. U | - Projected umbra area in millionths of solar disc, negative values indicate | |
|
that the umbra consists of fragmented regions which cannot be separated without losing umbral area. In this way several spots (intensity minima in the umbra) have a common umbra, e.g. -2 means that the given spot shares an umbra with spot No.2, and the common U value is indicated at spot No.2. |
||
| Proj. WS | - Projected whole spot area in millionths of solar disc, negative values indicate | |
|
that several umbras have a common penumbra, e.g. -7 means that the given umbra shares a penumbra with umbra No.7, and the WS value is indicated at No.7. |
||
| Corr. U | - Corrected umbra area in millionths of solar hemisphere, for negative values see above | |
| Corr. WS | - Corrected whole spot area in millionths of solar hemisphere, for negative values see above | |
| B | - Heliographic latitude B; positive: North, negative: South | |
| L | - Heliographic longitude L | |
| LCM | - Longitudinal distance from the Sun's central meridian | |
| Pos. angle | - Position angle | |
| r | - Distance from the centre of Sun's disc in terms of Sun's radius | |
| MU | - Mean magnetic field within the umbra contour averaged the pixel values with sign. | |
| MP | - Mean magnetic field within the penumbra contour averaged the pixel values with sign. | |