
move the mouse pointer over that image.
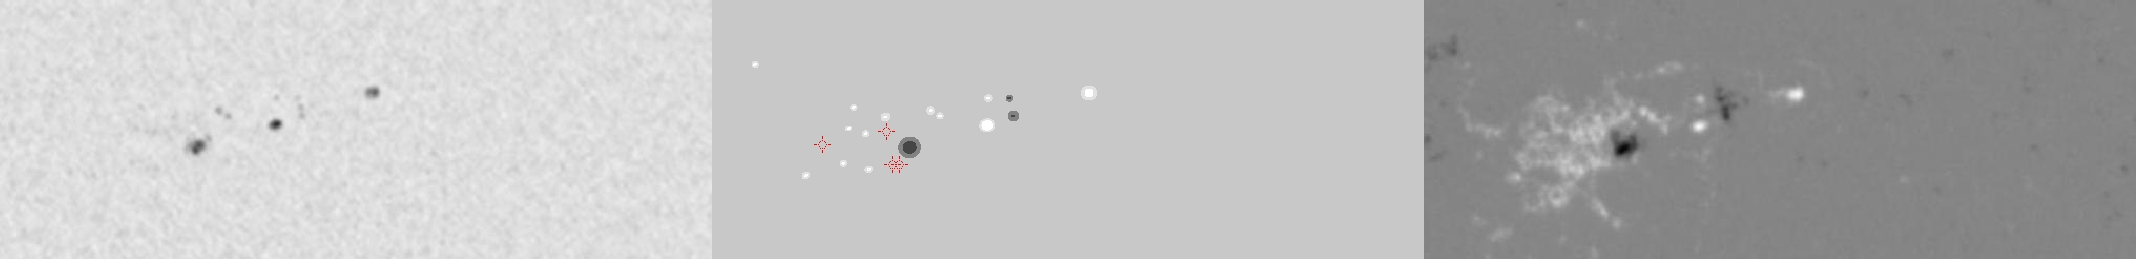
| Evolution of sunspot group NOAA 10338 and positions of flares in it animated by using the data of SOHO/MDI Debrecen Data (SDD) sunspot catalogue (lower panel, middle, ellipses with positions and areas corresponding to the relevant data of spots in SDD and with grey-scale colour coding of the magnetic polarities corresponding to that of the magnetograms), SOHO/MDI continuum images (lower panel, left) and magnetograms (lower panel, right), SOHO/EIT images (upper panel, middle), GOES and RHESSI flare data (red and blue symbols) observed within the interval around the time of SDD data. |
|
When you want to zoom in on one of the images, simply move the mouse pointer over that image. |
 |
| Year | Month | Day | Hour | Min | Sec | NOAA | Proj.U | Proj.WS | Corr.U | Corr.WS | B | L | LCM | Pos.angle | r | MU | MP |
|---|---|---|---|---|---|---|---|---|---|---|---|---|---|---|---|---|---|
| 2003 | 04 | 21 | 04 | 47 | 33 | 10338 | 33 | 156 | 18 | 85 | 17.88 | 285.50 | -4.60 | 11.09 | 0.3987 | -20.0 | 171.4 |
| Flare | Date | Start | Peak | End | Dur [s] | Peak [c/s] | Total Counts | Energy [keV] | X pos [asec] | Y pos [asec] | Radial [asec] | B [deg] | L [deg] | Flags |
|---|---|---|---|---|---|---|---|---|---|---|---|---|---|---|
| 3042132 | 21-Apr-2003 | 04:38:12 | 04:39:34 | 04:41:08 | 176 | 30 | 22776 | 6-12 | -91 | 355 | 367 | 16.44 | 283.45 | A0 |
| 3042180 | 21-Apr-2003 | 04:41:08 | 04:43:34 | 04:46:32 | 324 | 36 | 49776 | 6-12 | -86 | 355 | 366 | 16.44 | 283.73 | A0 |
| 3042135 | 21-Apr-2003 | 05:54:48 | 05:55:30 | 06:00:40 | 352 | 20 | 29160 | 6-12 | -73 | 376 | 383 | 17.78 | 283.84 | A0 |
| 3042102 | 21-Apr-2003 | 07:14:32 | 07:25:30 | 07:45:08 | 1836 | 1456 | 5546448 | 12-25 | -87 | 368 | 378 | 17.28 | 282.15 | A0 GS P1 |
| Date | Start | Peak | End | Classification | B [deg] | LCM [deg] |
|---|---|---|---|---|---|---|
| No data |

