
move the mouse pointer over that image.
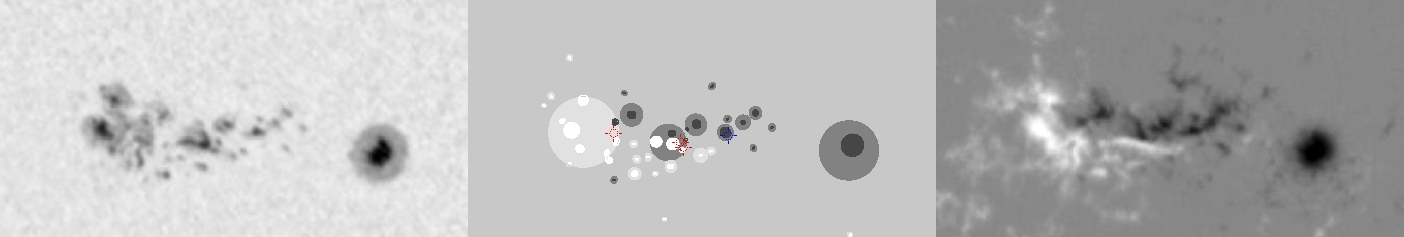
| Evolution of sunspot group NOAA 10826 and positions of flares in it animated by using the data of SOHO/MDI Debrecen Data (SDD) sunspot catalogue (lower panel, middle, ellipses with positions and areas corresponding to the relevant data of spots in SDD and with grey-scale colour coding of the magnetic polarities corresponding to that of the magnetograms), SOHO/MDI continuum images (lower panel, left) and magnetograms (lower panel, right), SOHO/EIT images (upper panel, middle), GOES and RHESSI flare data (red and blue symbols) observed within the interval around the time of SDD data. |
|
When you want to zoom in on one of the images, simply move the mouse pointer over that image. |
 |
| Year | Month | Day | Hour | Min | Sec | NOAA | Proj.U | Proj.WS | Corr.U | Corr.WS | B | L | LCM | Pos.angle | r | MU | MP |
|---|---|---|---|---|---|---|---|---|---|---|---|---|---|---|---|---|---|
| 2005 | 12 | 03 | 11 | 11 | 32 | 10826 | 194 | 1332 | 98 | 663 | -4.07 | 253.74 | 1.46 | 187.79 | 0.1078 | -199.7 | -0.0 |
| Flare | Date | Start | Peak | End | Dur [s] | Peak [c/s] | Total Counts | Energy [keV] | X pos [asec] | Y pos [asec] | Radial [asec] | B [deg] | L [deg] | Flags |
|---|---|---|---|---|---|---|---|---|---|---|---|---|---|---|
| 5120378 | 3-Dec-2005 | 10:34:52 | 10:35:22 | 10:42:00 | 428 | 7 | 11928 | 6-12 | 27 | -86 | 90 | -4.43 | 253.16 | A0 DF P1 |
| 5120349 | 3-Dec-2005 | 11:09:48 | 11:15:02 | 11:31:32 | 1304 | 192 | 903312 | 6-12 | 37 | -83 | 91 | -4.25 | 253.40 | A0 DF P1 |
| 5120379 | 3-Dec-2005 | 11:31:32 | 11:33:10 | 11:43:20 | 708 | 160 | 92568 | 6-12 | 1 | -77 | 77 | -3.90 | 251.08 | A0 DF DR P1 |
| Date | Start | Peak | End | Classification | B [deg] | LCM [deg] |
|---|---|---|---|---|---|---|
| 3-Dec-2005 | 11:10 | 11:23 | 11:41 | B6.6 | -04 | 03 |

