
move the mouse pointer over that image.
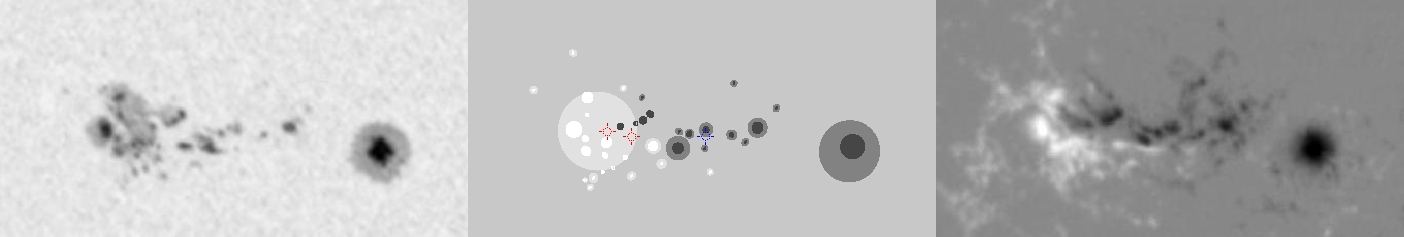
| Evolution of sunspot group NOAA 10826 and positions of flares in it animated by using the data of SOHO/MDI Debrecen Data (SDD) sunspot catalogue (lower panel, middle, ellipses with positions and areas corresponding to the relevant data of spots in SDD and with grey-scale colour coding of the magnetic polarities corresponding to that of the magnetograms), SOHO/MDI continuum images (lower panel, left) and magnetograms (lower panel, right), SOHO/EIT images (upper panel, middle), GOES and RHESSI flare data (red and blue symbols) observed within the interval around the time of SDD data. |
|
When you want to zoom in on one of the images, simply move the mouse pointer over that image. |
 |
| Year | Month | Day | Hour | Min | Sec | NOAA | Proj.U | Proj.WS | Corr.U | Corr.WS | B | L | LCM | Pos.angle | r | MU | MP |
|---|---|---|---|---|---|---|---|---|---|---|---|---|---|---|---|---|---|
| 2005 | 12 | 03 | 22 | 23 | 32 | 10826 | 191 | 1265 | 95 | 637 | -4.03 | 253.75 | 7.63 | 233.84 | 0.1588 | -319.5 | -11.3 |
| Flare | Date | Start | Peak | End | Dur [s] | Peak [c/s] | Total Counts | Energy [keV] | X pos [asec] | Y pos [asec] | Radial [asec] | B [deg] | L [deg] | Flags |
|---|---|---|---|---|---|---|---|---|---|---|---|---|---|---|
| 5120323 | 3-Dec-2005 | 21:49:44 | 21:56:38 | 22:17:52 | 1688 | 184 | 854688 | 6-12 | 99 | -78 | 127 | -4.02 | 251.23 | A0 DF DR P1 |
| 5120384 | 3-Dec-2005 | 22:17:52 | 22:24:18 | 22:34:24 | 992 | 100 | 232680 | 6-12 | 92 | -75 | 119 | -3.84 | 250.56 | A0 DF DR P1 |
| Date | Start | Peak | End | Classification | B [deg] | LCM [deg] |
|---|---|---|---|---|---|---|
| 3-Dec-2005 | 21:52 | 22:07 | 22:17 | B4.3 | -04 | 08 |

