
move the mouse pointer over that image.
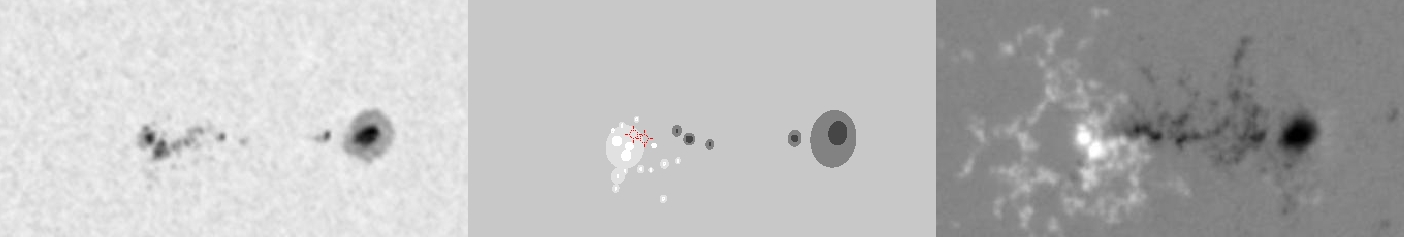
| Evolution of sunspot group NOAA 10826 and positions of flares in it animated by using the data of SOHO/MDI Debrecen Data (SDD) sunspot catalogue (lower panel, middle, ellipses with positions and areas corresponding to the relevant data of spots in SDD and with grey-scale colour coding of the magnetic polarities corresponding to that of the magnetograms), SOHO/MDI continuum images (lower panel, left) and magnetograms (lower panel, right), SOHO/EIT images (upper panel, middle), GOES and RHESSI flare data (red and blue symbols) observed within the interval around the time of SDD data. |
|
When you want to zoom in on one of the images, simply move the mouse pointer over that image. |
 |
| Year | Month | Day | Hour | Min | Sec | NOAA | Proj.U | Proj.WS | Corr.U | Corr.WS | B | L | LCM | Pos.angle | r | MU | MP |
|---|---|---|---|---|---|---|---|---|---|---|---|---|---|---|---|---|---|
| 2005 | 12 | 05 | 19 | 11 | 32 | 10826 | 81 | 550 | 48 | 333 | -4.24 | 255.52 | 34.01 | 261.85 | 0.5640 | -374.4 | -78.4 |
| Flare | Date | Start | Peak | End | Dur [s] | Peak [c/s] | Total Counts | Energy [keV] | X pos [asec] | Y pos [asec] | Radial [asec] | B [deg] | L [deg] | Flags |
|---|---|---|---|---|---|---|---|---|---|---|---|---|---|---|
| 5120512 | 5-Dec-2005 | 23:43:48 | 23:45:46 | 23:49:08 | 320 | 26 | 37320 | 6-12 | 560 | -74 | 565 | -4.11 | 253.64 | A0 DF P1 |
| 5120611 | 6-Dec-2005 | 01:15:36 | 01:16:18 | 01:19:12 | 216 | 22 | 22728 | 6-12 | 576 | -71 | 581 | -3.94 | 253.99 | A0 DF P1 |
| Date | Start | Peak | End | Classification | B [deg] | LCM [deg] |
|---|---|---|---|---|---|---|
| No data |

