
move the mouse pointer over that image.
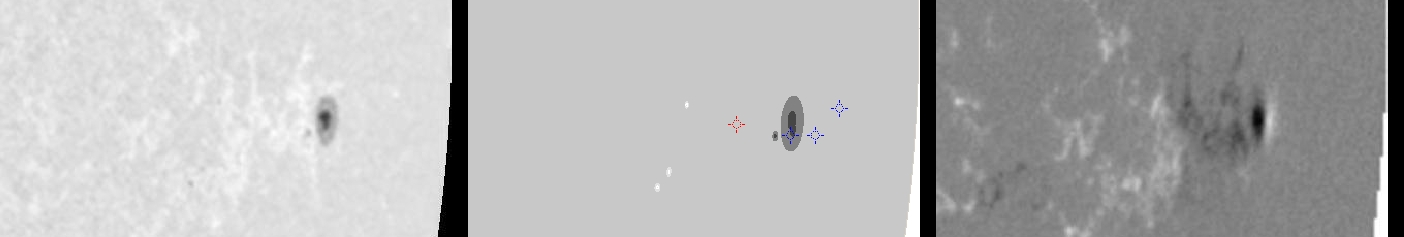
| Evolution of sunspot group NOAA 10826 and positions of flares in it animated by using the data of SOHO/MDI Debrecen Data (SDD) sunspot catalogue (lower panel, middle, ellipses with positions and areas corresponding to the relevant data of spots in SDD and with grey-scale colour coding of the magnetic polarities corresponding to that of the magnetograms), SOHO/MDI continuum images (lower panel, left) and magnetograms (lower panel, right), SOHO/EIT images (upper panel, middle), GOES and RHESSI flare data (red and blue symbols) observed within the interval around the time of SDD data. |
|
When you want to zoom in on one of the images, simply move the mouse pointer over that image. |
 |
| Year | Month | Day | Hour | Min | Sec | NOAA | Proj.U | Proj.WS | Corr.U | Corr.WS | B | L | LCM | Pos.angle | r | MU | MP |
|---|---|---|---|---|---|---|---|---|---|---|---|---|---|---|---|---|---|
| 2005 | 12 | 07 | 22 | 23 | 32 | 10826 | 20 | 142 | 25 | 172 | -3.52 | 259.38 | 66.00 | 266.12 | 0.9151 | -639.4 | -99.1 |
| Flare | Date | Start | Peak | End | Dur [s] | Peak [c/s] | Total Counts | Energy [keV] | X pos [asec] | Y pos [asec] | Radial [asec] | B [deg] | L [deg] | Flags |
|---|---|---|---|---|---|---|---|---|---|---|---|---|---|---|
| 5120711 | 7-Dec-2005 | 23:48:36 | 23:49:14 | 23:54:20 | 344 | 40 | 40944 | 6-12 | 866 | -61 | 868 | -3.59 | 256.14 | A0 |
| Date | Start | Peak | End | Classification | B [deg] | LCM [deg] |
|---|---|---|---|---|---|---|
| 8-Dec-2005 | 00:41 | 00:48 | 00:58 | B1.5 | -04 | 68 |
| 8-Dec-2005 | 03:15 | 03:37 | 03:59 | B4.0 | -04 | 72 |
| 8-Dec-2005 | 15:29 | 15:36 | 15:49 | B5.0 | -03 | 81 |

