
move the mouse pointer over that image.
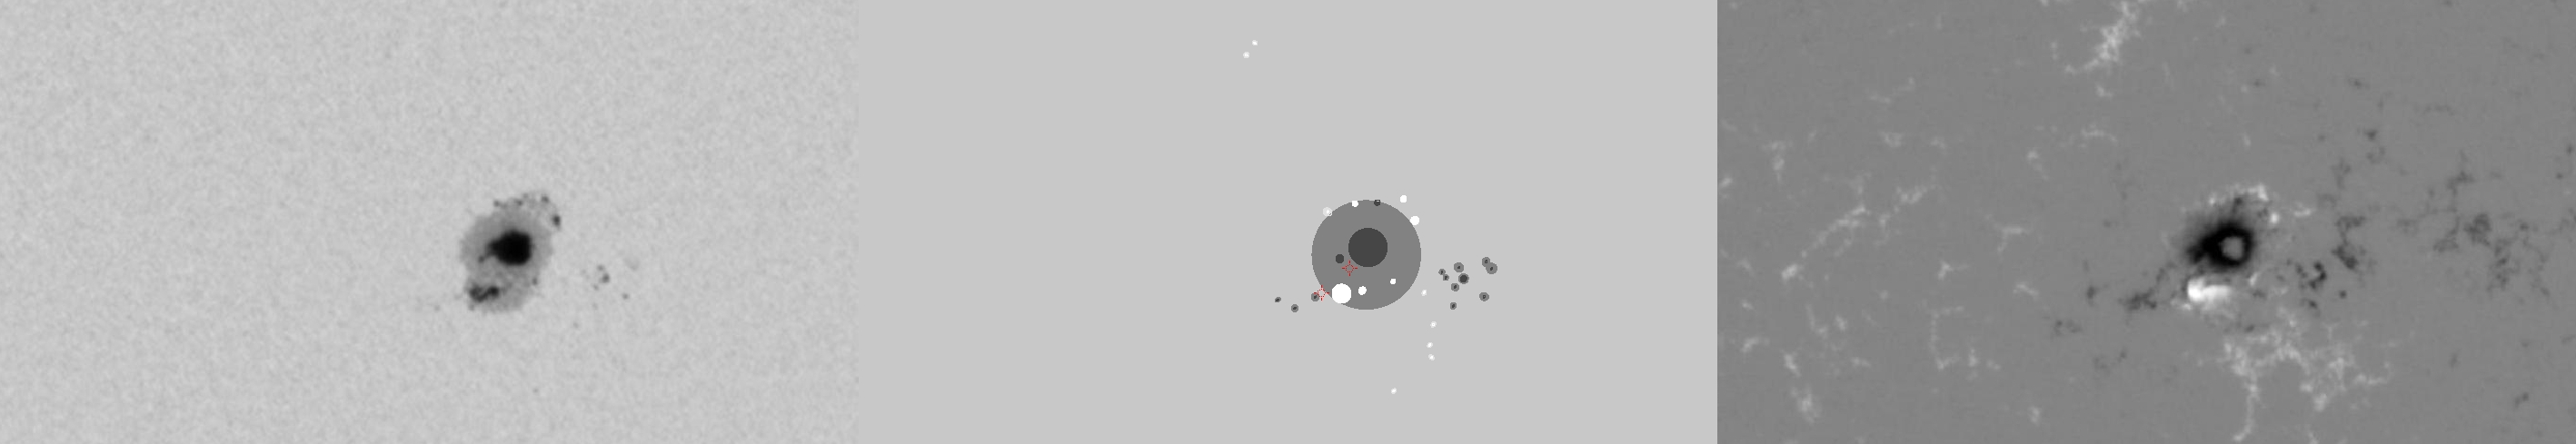
| Evolution of sunspot group NOAA 10930 and positions of flares in it animated by using the data of SOHO/MDI Debrecen Data (SDD) sunspot catalogue (lower panel, middle, ellipses with positions and areas corresponding to the relevant data of spots in SDD and with grey-scale colour coding of the magnetic polarities corresponding to that of the magnetograms), SOHO/MDI continuum images (lower panel, left) and magnetograms (lower panel, right), SOHO/EIT images (upper panel, middle), GOES and RHESSI flare data (red and blue symbols) observed within the interval around the time of SDD data. |
|
When you want to zoom in on one of the images, simply move the mouse pointer over that image. |
 |
| Year | Month | Day | Hour | Min | Sec | NOAA | Proj.U | Proj.WS | Corr.U | Corr.WS | B | L | LCM | Pos.angle | r | MU | MP |
|---|---|---|---|---|---|---|---|---|---|---|---|---|---|---|---|---|---|
| 2006 | 12 | 12 | 01 | 35 | 31 | 10930 | 278 | 1641 | 141 | 824 | -5.21 | 9.23 | 8.01 | 239.28 | 0.1640 | -757.5 | -393.2 |
| Flare | Date | Start | Peak | End | Dur [s] | Peak [c/s] | Total Counts | Energy [keV] | X pos [asec] | Y pos [asec] | Radial [asec] | B [deg] | L [deg] | Flags |
|---|---|---|---|---|---|---|---|---|---|---|---|---|---|---|
| 6121275 | 12-Dec-2006 | 01:31:32 | 01:32:30 | 01:35:32 | 240 | 38 | 34368 | 6-12 | 115 | -108 | 159 | -6.81 | 7.27 | A0 |
| 6121202 | 12-Dec-2006 | 01:39:32 | 01:41:02 | 01:44:16 | 284 | 160 | 94416 | 6-12 | 137 | -91 | 164 | -5.80 | 8.50 | A0 |
| Date | Start | Peak | End | Classification | B [deg] | LCM [deg] |
|---|---|---|---|---|---|---|
| No data |

